---
title: "Prof D's Regression Sessions - Vol 4"
subtitle: "Good Skool / Bad Skool Breaks - a logistic regression walkthrough"
author: "Adam Dennett"
date: "Week GLM"
format:
html:
code-fold: true
code-tools: true
toc: true
toc-depth: 2
ipynb: default
filters:
- qna
- multicode
- quarto # keep Quarto's built-ins as the last filter or it won't work
editor:
markdown:
wrap: 72
---
```{r}
#| label: practical-setup
#| include: false
#| message: false
#| warning: false
library(here)
library(knitr)
knitr::opts_chunk$set(message = FALSE, warning = FALSE)
```
```{=html}
<iframe data-testid="embed-iframe" style="border-radius:12px" src="https://open.spotify.com/embed/track/0ZYx2hZKhUbUiNpzmptlGR?utm_source=generator&si=510ca229e8114a26" width="100%" height="352" frameBorder="0" allowfullscreen="" allow="autoplay; clipboard-write; encrypted-media; fullscreen; picture-in-picture" loading="lazy"></iframe>
```
## Preamble
Three volumes of the Regression Sessions have all relied on the idea that the thing we are trying to predict is a continuous number. That number can wander up and down a straight line without ever embarrassing us by predicting something mad!
It's one of the core assumptions of ordinary least squares linear regression, but today we are going to break it. Our outcome is a **yes/no**: is this school rated below
Good by Ofsted? A straight line is the wrong tool for that job, and the
first task of the practical is to watch it fail - properly, on real data,
with numbers you can point at - before we reach for a totally different tool that fixes it.
## Practical aims
1. Fit a linear probability model to a 0/1 outcome and find its impossible
predictions
2. Fit, and *read*, a binary logistic regression - including saying an odds
ratio out loud in a sentence a non-statistician would understand
3. Judge the fit with deviance, AIC and the pseudo-R²s
4. Judge the **decisions** honestly: against a baseline, with a confusion
matrix, and with ROC and AUC
5. Take at least one of the two extensions further than the lecture went
## Before you start: the two tabs
Every code block below has an **R** tab and a **Python** tab. They are not
loose translations of each other - they do the same arithmetic on the same
rows and produce the same numbers, to four decimal places, all the way
through. If your two tabs disagree, something has gone wrong, and that is
worth chasing down.
::: {.callout-note title="Keep the whole thing reproducible"}
We split the data into training and test sets using the **row position after
sorting by URN**, not a random number generator. That is deliberate: R's
`sample()` and Python's random number generators will never agree with one
another, and you would spend the afternoon wondering why your AUC was not
mine. Sorting and taking every tenth school is boring, reproducible, and
gives the same 2,219 training and 951 test schools in both languages.
:::
# Part 0: The data
## Task 0 - Load the schools data and build the outcome
We use the same four DfE files as the lecture. Three things are happening
here that are worth noticing rather than skimming:
- **Rows with no URN are dropped.** The files carry local authority and
national summary rows that are not schools. They also duplicate rows on
a join, because a missing key matches another missing key.
- **Ofsted's five published grades collapse to a binary.** `below_good`
is 1 for *Requires improvement*, *Serious Weaknesses* and *Special
Measures*, and 0 for *Good* and *Outstanding*.
- **We keep mainstream secondaries only**, so that we are comparing
schools that are doing roughly the same job.
- Also note how we generate a new binary variable from OFSTEDRATING for schools that are below Good and the rest. This is created differently in R and Python.
::: {.multicode}
#### {width="41" height="30"}
```{r}
#| label: load-r
library(tidyverse)
library(here)

base_path <- here("sessions", "data", "Performancetables_130242", "2022-2023")

# The DfE publishes suppressed / not-applicable values as codes, not blanks
na_all <- c("", "NA", "SUPP", "NP", "NE", "SP", "SN", "LOWCOV", "NEW", "SUPPMAT")

read_dfe <- function(f) {
  suppressWarnings(
    read_csv(file.path(base_path, f), na = na_all, show_col_types = FALSE)
  ) |>
    mutate(URN = as.character(URN)) |>
    filter(!is.na(URN))
}

ks4 <- read_dfe("england_ks4final.csv") |>
  select(URN, ATT8SCR, P8MEA, TPUP, PTFSM6CLA1A, PTPRIORHI) |>
  mutate(across(-URN, ~ parse_number(as.character(.x))))

absence <- read_dfe("england_abs.csv") |>
  distinct(URN, .keep_all = TRUE) |>
  select(URN, PERCTOT, PPERSABS10) |>
  mutate(across(-URN, ~ parse_number(as.character(.x))))

school_info <- read_dfe("england_school_information.csv") |>
  select(URN, SCHNAME, LANAME, MINORGROUP, OFSTEDRATING)

schools <- ks4 |>
  inner_join(absence, by = "URN") |>
  inner_join(school_info, by = "URN") |>
  filter(MINORGROUP %in% c("Academy", "Maintained school"),
         OFSTEDRATING %in% c("Outstanding", "Good", "Requires improvement",
                             "Serious Weaknesses", "Special Measures")) |>
  mutate(below_good = as.integer(
    OFSTEDRATING %in% c("Requires improvement", "Serious Weaknesses",
                        "Special Measures")))

# Complete cases only, sorted, so the split below is reproducible
model_data <- schools |>
  drop_na(P8MEA, PTFSM6CLA1A, PERCTOT, PPERSABS10, TPUP, PTPRIORHI) |>
  arrange(URN)

nrow(model_data)
mean(model_data$below_good)
```
#### {width="30"}
```{python}
#| label: load-py
import pandas as pd
import numpy as np
from pathlib import Path

# Little function to find the project root on any machine
def find_qm_root(start_path: Path = Path.cwd(), anchor: str = "_quarto.yml") -> Path:
    for parent in [start_path] + list(start_path.parents):
        if (parent / anchor).exists() or parent.name == anchor:
            return parent
    raise FileNotFoundError(f"Anchor '{anchor}' not found in path hierarchy.")

qm_root = find_qm_root()
base_path = qm_root / "sessions" / "data" / "Performancetables_130242" / "2022-2023"

na_all = ["", "NA", "SUPP", "NP", "NE", "SP", "SN", "LOWCOV", "NEW", "SUPPMAT"]

def read_dfe(f, cols):
    d = pd.read_csv(base_path / f, na_values=na_all, dtype={"URN": str},
                    low_memory=False)
    return d[d["URN"].notna()][cols]

def to_num(df, cols):
    for c in cols:
        df[c] = pd.to_numeric(df[c].astype(str).str.replace("%", "", regex=False),
                              errors="coerce")
    return df

ks4 = read_dfe("england_ks4final.csv",
               ["URN", "ATT8SCR", "P8MEA", "TPUP", "PTFSM6CLA1A", "PTPRIORHI"])
ks4 = to_num(ks4, ["ATT8SCR", "P8MEA", "TPUP", "PTFSM6CLA1A", "PTPRIORHI"])

absence = read_dfe("england_abs.csv", ["URN", "PERCTOT", "PPERSABS10"]) \
            .drop_duplicates("URN")
absence = to_num(absence, ["PERCTOT", "PPERSABS10"])

school_info = read_dfe("england_school_information.csv",
                       ["URN", "SCHNAME", "LANAME", "MINORGROUP", "OFSTEDRATING"])

schools = ks4.merge(absence, on="URN").merge(school_info, on="URN")
schools = schools[schools["MINORGROUP"].isin(["Academy", "Maintained school"])]
schools = schools[schools["OFSTEDRATING"].isin(
    ["Outstanding", "Good", "Requires improvement",
     "Serious Weaknesses", "Special Measures"])]
schools["below_good"] = schools["OFSTEDRATING"].isin(
    ["Requires improvement", "Serious Weaknesses", "Special Measures"]).astype(int)

model_data = (schools
    .dropna(subset=["P8MEA", "PTFSM6CLA1A", "PERCTOT", "PPERSABS10",
                    "TPUP", "PTPRIORHI"])
    .sort_values("URN")
    .reset_index(drop=True))

print(len(model_data))
print(model_data["below_good"].mean())
```
:::
::: {.callout-tip title="Check before you go on"}
You should have **3,170 schools**, and **15.0%** of them below Good. If you
have a different number, your filters have not matched mine and every figure
below will drift.
:::
::: {.callout-important title="15% is the number to remember"}
Only 15 schools in 100 are below Good. Write that down. It is going to come
back and ruin our afternoon at Task 10, in the most instructive way possible.
:::
# Part 1: Watching a straight line fail
## Task 1 - Fit the linear probability model
Before we do anything clever, do the obvious wrong thing. `below_good` is a
column of 0s and 1s, and nothing stops you putting it on the left of an
`lm()`. So put it there, regress it on Progress 8, and look at what comes
back out.
::: {.multicode}
#### {width="41" height="30"}
```{r}
#| label: lpm-r
lpm <- lm(below_good ~ P8MEA, data = model_data)
fitted_lpm <- fitted(lpm)

range(fitted_lpm)
sum(fitted_lpm < 0)
sum(fitted_lpm > 1)
summary(lpm)
```
#### {width="30"}
```{python}
#| label: lpm-py
import statsmodels.formula.api as smf

lpm = smf.ols("below_good ~ P8MEA", data=model_data).fit()
fitted_lpm = lpm.fittedvalues

print(fitted_lpm.min(), fitted_lpm.max())
print((fitted_lpm < 0).sum())
print((fitted_lpm > 1).sum())
```
:::
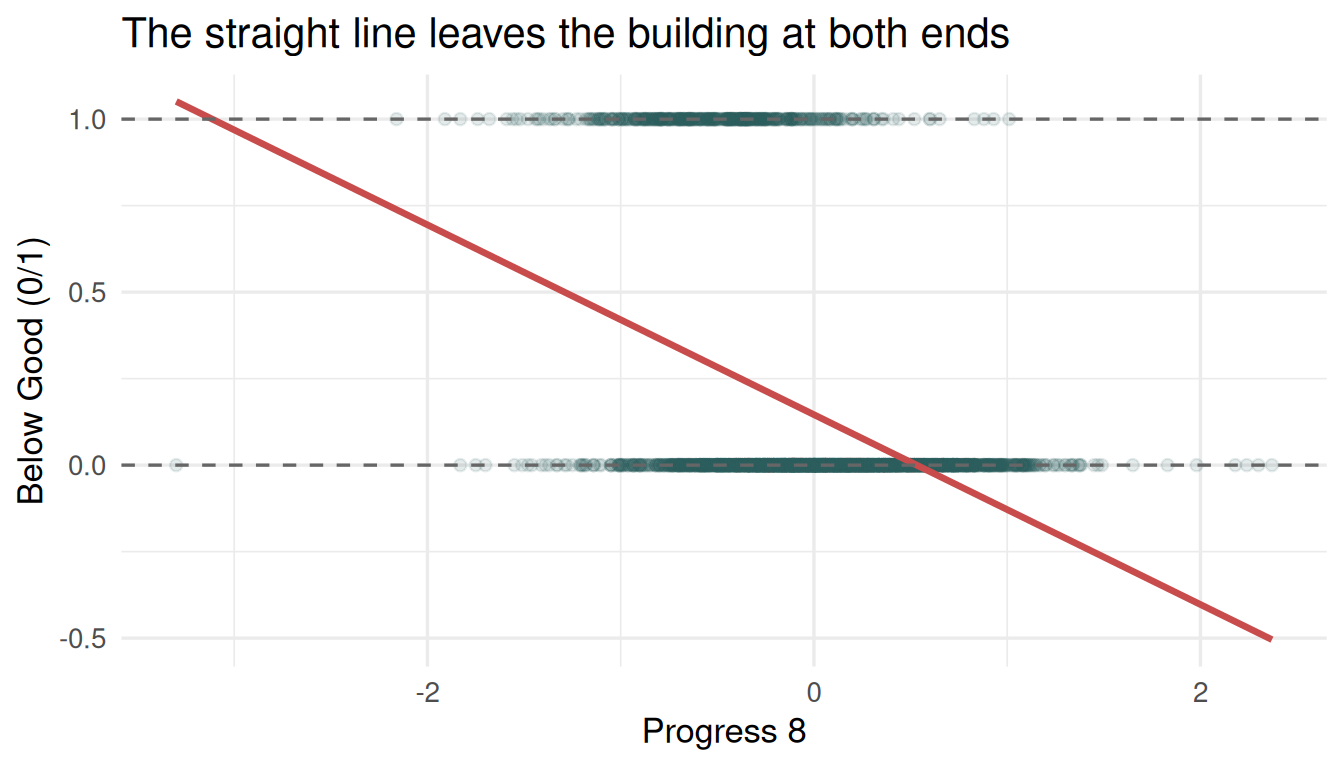
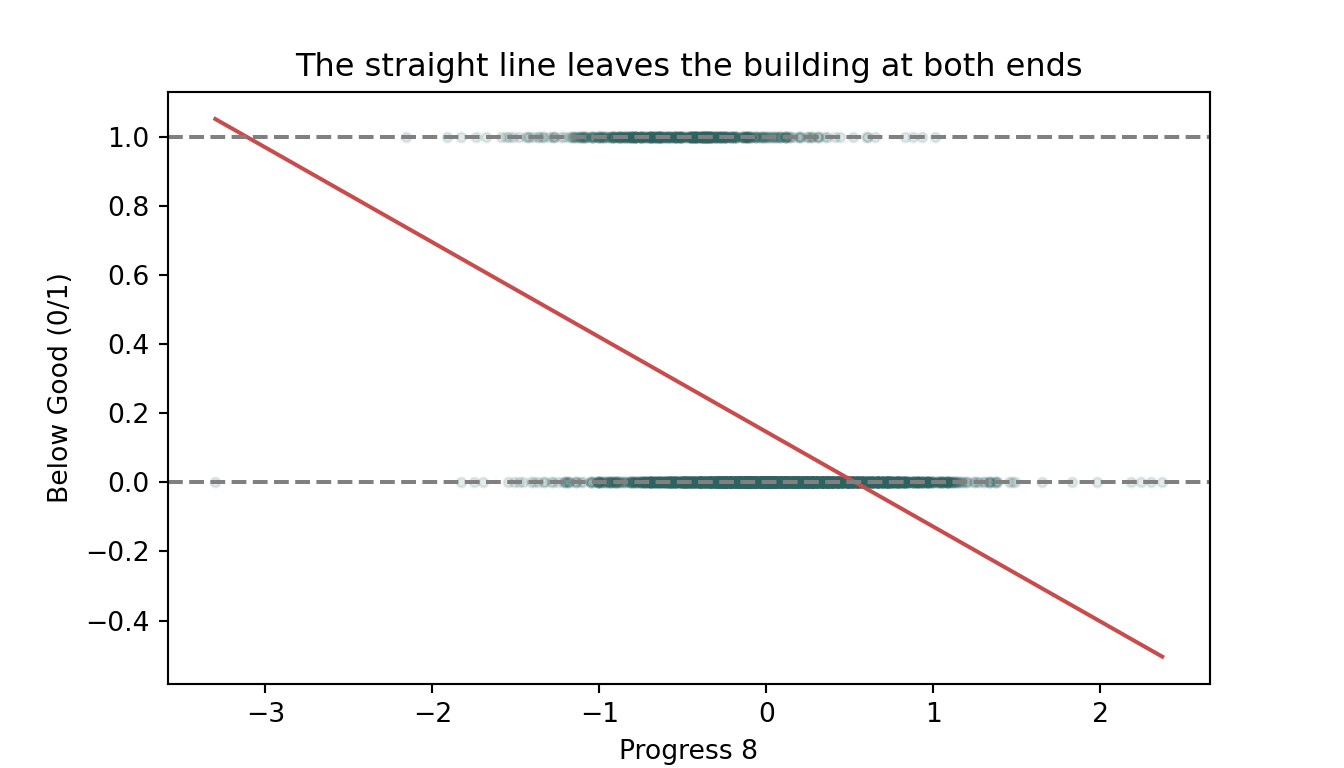
The model's lowest fitted value is about **-0.50**. It is telling us that a
school with very strong Progress 8 has a **minus fifty per cent chance** of
being rated below Good.
**457 schools** are given a negative probability. One is given a probability
above 1.
::: {.callout-tip title="Question"}
A probability of -0.5 is not merely an unlikely event, or a very small
chance. What *is* it? And can you fix this by just rounding the negative
predictions up to zero? Write down one reason why that patch would be
dishonest before you read on.
:::
## Task 2 - See it
Numbers are easy to shrug at. Plot it.
::: {.multicode}
#### {width="41" height="30"}
```{r}
#| label: lpm-plot-r
#| fig-width: 7
#| fig-height: 4
ggplot(model_data, aes(x = P8MEA, y = below_good)) +
  geom_point(alpha = 0.12, colour = "#2E6260") +
  geom_smooth(method = "lm", se = FALSE, colour = "#C94C4C") +
  geom_hline(yintercept = c(0, 1), linetype = "dashed", colour = "grey40") +
  labs(x = "Progress 8", y = "Below Good (0/1)",
       title = "The straight line leaves the building at both ends") +
  theme_minimal(base_size = 13)
```
#### {width="30"}
```{python}
#| label: lpm-plot-py
import matplotlib.pyplot as plt

fig, ax = plt.subplots(figsize=(7, 4))
ax.scatter(model_data["P8MEA"], model_data["below_good"], alpha=0.12,
           color="#2E6260", s=12)
xs = np.linspace(model_data["P8MEA"].min(), model_data["P8MEA"].max(), 100)
ax.plot(xs, lpm.params["Intercept"] + lpm.params["P8MEA"] * xs, color="#C94C4C")
ax.axhline(0, ls="--", color="grey"); ax.axhline(1, ls="--", color="grey")
ax.set_xlabel("Progress 8"); ax.set_ylabel("Below Good (0/1)")
ax.set_title("The straight line leaves the building at both ends")
plt.show()
```
:::
The dashed lines at 0 and 1 are the only values the outcome can actually
take. The red line crosses both of them and keeps going, because that is
what straight lines do. **Nothing in `lm()` knows that probabilities stop.**
# Part 2: Your first logistic regression
## Task 3 - Fit it
The fix is to stop modelling the probability directly, and model the
**log-odds** of it instead - a quantity that is perfectly happy running from
minus infinity to plus infinity. That is the *link function*, and in R and
Python it is one argument.
::: {.multicode}
#### {width="41" height="30"}
```{r}
#| label: logit1-r
logit1 <- glm(below_good ~ P8MEA, data = model_data, family = binomial)

summary(logit1)
```
#### {width="30"}
```{python}
#| label: logit1-py
import statsmodels.api as sm

logit1 = smf.glm("below_good ~ P8MEA", data=model_data,
                 family=sm.families.Binomial()).fit()

print(logit1.summary())
```
:::
Both languages give you an intercept of **-2.3235** and a Progress 8
coefficient of **-2.6987**. Check that yours match before going on.
::: {.callout-note title="What changed, and what didn't"}
`glm(..., family = binomial)` instead of `lm(...)`. That is the whole
difference in the code. Everything you learned about reading a `summary()`
table - estimates, standard errors, p-values, which predictors earn their
place - still applies. What has changed is **what the estimates mean**, and
that is the next two tasks.
:::
## Task 4 - The recipe for reading a coefficient
Those coefficients are on the log-odds scale, and nobody thinks in log-odds.
The recipe is three steps, and you will use it for the rest of your life:
::: {.callout-important title="The recipe"}
1. **Exponentiate the coefficient.** `exp(coef)` turns a log-odds
difference into an **odds ratio**.
2. **The odds ratio is the multiplier for a one-unit increase** in that
predictor.
3. **Say it out loud.** Above 1 means the odds go up; below 1 means they
go down.
:::
::: {.multicode}
#### {width="41" height="30"}
```{r}
#| label: or1-r
exp(coef(logit1))
```
#### {width="30"}
```{python}
#| label: or1-py
print(np.exp(logit1.params))
```
:::
You should get **0.0979** for the intercept and **0.0673** for Progress 8.
Step 3 is the one that is actually hard, and the one the assessment will ask
you for. Here is the Progress 8 one written out:
> *Every one-point increase in Progress 8 multiplies a school's odds of
> being rated below Good by **0.067** - that is, it cuts them to about a
> fifteenth.*
::: {.callout-tip title="Question"}
Write the same sentence for the **intercept**. Two warnings. First, Progress
8 is already centred so that 0 is the national average, which makes the
intercept meaningful here - it is the odds for an average school. Second,
check it against the data: of the 283 schools within 0.05 of a Progress 8 of
zero, what fraction really are below Good? You should find about **6%**,
where the model puts them at **8.9%**. The model is not obliged to match the
local average - it is fitting one smooth curve across the whole range, and
this is where you see the price of that. Is it a price worth paying?
:::
## Task 5 - And back to a probability
Odds are not probabilities, and your reader will want a probability. Going
back is one line, and you never have to do it by hand.
::: {.multicode}
#### {width="41" height="30"}
```{r}
#| label: pred1-r
new_schools <- data.frame(P8MEA = c(-1, -0.5, 0, 0.5, 1))
new_schools$prob <- predict(logit1, newdata = new_schools, type = "response")
new_schools
```
#### {width="30"}
```{python}
#| label: pred1-py
new_schools = pd.DataFrame({"P8MEA": [-1, -0.5, 0, 0.5, 1]})
new_schools["prob"] = logit1.predict(new_schools)
print(new_schools)
```
:::
::: {.callout-tip title="Question"}
`type = "response"` in R, and plain `.predict()` in Python, both give you a
probability. Look at the five numbers. Are they equally spaced? The
Progress 8 values are. Why aren't the probabilities - and is that a bug or
the entire point of what we did in Task 3?
:::
# Part 3: More than one predictor
## Task 6 - The full model, and the split
Two things happen at once here, and it is worth being clear about why.
First, we add predictors. Second - and this is new - we **stop fitting to all
the data**. From here on the model is fitted on 70% of schools and judged on
the 30% it has never seen. Everything in Part 5 depends on that separation,
so we do it before we fit rather than bolting it on afterwards.
::: {.callout-note title="Why bother — remember the wiggly red line"}
The lecture showed two models fitted to fifteen points: a sensible curve, and
one forced through every single point. The second had an average error of
**0.00** on the data it was fitted to, and was the **worse** of the two on
fifteen points it had never seen.
That is overfitting, and it is why a model's performance on its own training
data is not evidence. You can always improve that number by adding terms. The
only honest test is data the model has never seen - which is what the next two
lines create.
:::
::: {.multicode}
#### {width="41" height="30"}
```{r}
#| label: split-r
# Deterministic split on sorted row position - identical in R and Python.
# Note the - 1: R counts rows from 1 and Python from 0, and without it the
# two languages would quietly select different schools.
idx   <- seq_len(nrow(model_data)) - 1
test  <- model_data[idx %% 10 <  3, ]
train <- model_data[idx %% 10 >= 3, ]

c(train = nrow(train), test = nrow(test))
logit_full <- glm(below_good ~ P8MEA + PTFSM6CLA1A + PERCTOT +
                    PPERSABS10 + log(TPUP) + PTPRIORHI,
                  data = train, family = binomial)

summary(logit_full)
```
#### {width="30"}
```{python}
#| label: split-py
idx   = np.arange(len(model_data))
test  = model_data[idx % 10 <  3].copy()
train = model_data[idx % 10 >= 3].copy()

print({"train": len(train), "test": len(test)})
logit_full = smf.glm(
    "below_good ~ P8MEA + PTFSM6CLA1A + PERCTOT + PPERSABS10 "
    "+ np.log(TPUP) + PTPRIORHI",
    data=train, family=sm.families.Binomial()).fit()

print(logit_full.summary())
```
:::
You should have **2,219 training** and **951 test** schools, and an intercept
of **-4.7376**.
::: {.callout-warning title="Your numbers will not match the lecture's — and that is correct"}
The lecture split the schools with `set.seed(42)` and `sample()`. We split on
sorted row position instead, for the reason given at the top: R's and Python's
random number generators will never agree with each other.
Both splits take 70/30 of the same 3,170 schools, so **both give 2,219 and
951**. But they are a *different* 951 schools — so every test-set figure from
here on differs a little from the lecture's:
| | Lecture | Here |
|---|---|---|
| Test-set accuracy | 86.2% | **86.9%** |
| Majority-class baseline | 85.3% | **86.9%** |
| AUC | 0.818 | **0.812** |
Do not go hunting for a bug. The conclusion is the same in both, and here it is even clearer: in the lecture the model beat the baseline by 0.9 points, and on this split it does not beat it **at all**.
:::
## Task 7 - Say all six out loud
Same recipe as Task 4, applied six times.
::: {.multicode}
#### {width="41" height="30"}
```{r}
#| label: or-full-r
round(exp(coef(logit_full)), 4)
```
#### {width="30"}
```{python}
#| label: or-full-py
print(np.exp(logit_full.params).round(4))
```
:::
::: {.callout-tip title="Question - this is the exercise, not the code"}
Write one plain-English sentence per predictor. Then answer two harder
questions:
1. `PERCTOT` (overall absence) has an odds ratio above 1, and
`PTFSM6CLA1A` (free school meals) has one just below. Does that mean absence matters and poverty does not? What else changed when you moved from one predictor to six?
2. The intercept is now the odds for a school with Progress 8 of zero,
**zero free school meals, zero absence, zero prior-high-attainers and a cohort of one pupil** - because `log(TPUP)` is 0 when `TPUP` is 1. How many such schools exist? What does that tell you about quoting the intercept in a write-up?
:::
## Task 8 - Centre the predictors, and get an intercept worth quoting
Task 7 left you with a useless intercept: the odds for a school with a cohort of one pupil, no absence and no disadvantaged pupils. No such school exists.
There is a standard fix. **Subtract each predictor's mean from itself**, so that zero stops meaning *none* and starts meaning *average*. Progress 8 already arrives this way - that is why it behaved sensibly in Task 3.
::: {.multicode}
#### {width="41" height="30"}
```{r}
#| label: centre-r
train_c <- train |>
  mutate(log_TPUP = log(TPUP),
         across(c(P8MEA, PTFSM6CLA1A, PERCTOT, PPERSABS10, log_TPUP, PTPRIORHI),
                ~ .x - mean(.x), .names = "c_{.col}"))

logit_centred <- glm(below_good ~ c_P8MEA + c_PTFSM6CLA1A + c_PERCTOT +
                       c_PPERSABS10 + c_log_TPUP + c_PTPRIORHI,
                     data = train_c, family = binomial)

# the intercept, three ways
c(log_odds = coef(logit_centred)[[1]],
  odds     = exp(coef(logit_centred)[[1]]),
  prob     = plogis(coef(logit_centred)[[1]]))
```
#### {width="30"}
```{python}
#| label: centre-py
train_c = train.copy()
train_c["log_TPUP"] = np.log(train_c["TPUP"])
for v in ["P8MEA", "PTFSM6CLA1A", "PERCTOT", "PPERSABS10", "log_TPUP", "PTPRIORHI"]:
    train_c["c_" + v] = train_c[v] - train_c[v].mean()

logit_centred = smf.glm(
    "below_good ~ c_P8MEA + c_PTFSM6CLA1A + c_PERCTOT + c_PPERSABS10 "
    "+ c_log_TPUP + c_PTPRIORHI",
    data=train_c, family=sm.families.Binomial()).fit()

b0 = logit_centred.params["Intercept"]
print({"log_odds": round(b0, 4),
       "odds": round(np.exp(b0), 4),
       "prob": round(1 / (1 + np.exp(-b0)), 4)})
```
:::
::: {.callout-important title="Compare the two intercepts"}
| | Intercept | $e^{\beta_0}$ (odds) | as a probability |
|---|---|---|---|
| Task 6 model, uncentred | −4.7376 | 0.0088 | **0.9%** |
| Centred | −2.3174 | 0.0985 | **9.0%** |
The first describes a school that does not exist. The second describes a
school at the average of every predictor - and **that** is a sentence you can
put in a report.
:::
::: {.callout-tip title="Questions"}
1. **Compare the other six coefficients with the ones from Task 7.** They
should be *identical* - and so should the deviance, the AIC and every
pseudo-R². Check that they are. If centring changes none of those, what
exactly *has* it changed, and why was it worth doing?
2. Write the sentence. "A school at the national average on every one of
these measures has a ___ chance of being rated below Good."
3. **The awkward one.** 15.8% of the training schools really are below Good,
but the centred intercept says an *average* school has a 9.0% chance. Those
are not the same number and neither is wrong. Why not? *(Hint: the model
is linear in log-odds, not in probability - so the probability at the
average school is not the average of the probabilities. You met this in
Week 1 as the difference between the mean of the logs and the log of the
mean.)*
4. Centring is not the only option. What would you subtract instead if you
wanted the intercept to describe a *specific, real* school - say, a
median-sized school in your own local authority?
:::
# Part 4: Does the model fit?
## Task 9 - Deviance, AIC and the pseudo-R-squareds
There is no R-squared here, because there are no residuals in the sense OLS
means. What we have instead is a set of numbers built on the **likelihood** -
how surprised the model is by the data it saw.
Every one of these is already sitting in the output you printed at Task 6.
The point of this task is to find them there, not to compute them afresh.
::: {.multicode}
#### {width="41" height="30"}
```{r}
#| label: fit-stats-r
logLik(logit_full)
logit_full$null.deviance # a model with the intercept only
logit_full$deviance # our model
AIC(logit_full)
# The pseudo-R-squareds are not in base R
performance::r2_coxsnell(logit_full)
performance::r2_nagelkerke(logit_full)
```
#### {width="30"}
```{python}
#| label: fit-stats-py
print(logit_full.llf) # log-likelihood
print(logit_full.null_deviance)
print(logit_full.deviance)
print(logit_full.aic)
# statsmodels has no built-in pseudo-R2 for GLM, so compute them directly
n   = logit_full.nobs
cs  = 1 - np.exp((logit_full.llnull - logit_full.llf) * 2 / n)
nag = cs / (1 - np.exp(2 * logit_full.llnull / n))
print({"Cox & Snell": round(cs, 4), "Nagelkerke": round(nag, 4)})
```
:::
::: {.callout-warning title="Python trap — `.prsquared` is not the number you just computed"}
`smf.glm()` has no `.prsquared` attribute. `smf.logit()` **does**, and it is
very tempting to reach for it instead of writing those two lines out.
It is **McFadden's** pseudo-R², which is a different measure built a different
way. Fit this model both ways and compare:
```python
lg = smf.logit("below_good ~ P8MEA + PTFSM6CLA1A + PERCTOT + PPERSABS10 "
               "+ np.log(TPUP) + PTPRIORHI", data=train).fit(disp=0)
print(lg.prsquared)
```
You should get **0.2416**, against the **0.3264** Nagelkerke you computed
above. Same data, same fit, two numbers with the same nickname. Whichever you
report, **name it**.
R users are not immune: `performance::r2_mcfadden()` sits right next to
`r2_nagelkerke()` and will give you the same 0.2416.
:::
::: {.callout-note title="How to read them"}
- **Null deviance vs residual deviance.** The first is how badly an
intercept-only model does; the second is how badly ours does. The drop
between them is what the predictors bought you.
- **AIC** is the log-likelihood with a fine for each extra parameter. It is
only meaningful **compared with another model on the same data** - an AIC
on its own means nothing at all.
- **Cox & Snell** cannot reach 1, even for a perfect model. **Nagelkerke**
rescales it so that it can. Neither one is "the proportion of variance
explained", whatever your software calls it.
:::
::: {.callout-tip title="Question"}
Drop `PTPRIORHI` and refit. Does AIC go up or down? Now drop `P8MEA`
instead. Which of the two was carrying the model - and does the answer
surprise you, given the p-values?
:::
# Part 5: Does it make good decisions?
::: {.callout-important title="This part is not just about logistic regression"}
Holding data back, comparing against a baseline, and separating *fit* from
*prediction* apply to **every** model you will ever build, including the OLS
and multilevel models of the past three weeks. What is specific to today is
only the **scoreboard** - accuracy, confusion matrices and AUC need a
categorical outcome to be defined at all.
:::
## Task 10 - Predict, and compare with doing nothing
The model does not hand back a yes or a no. For each school it hands back a
**probability**, so before counting anything, watch what the 0.5 cut-off does
to four individual schools.
### 10a - Four schools, one at a time
::: {.multicode}
#### {width="41" height="30"}
```{r}
#| label: walkthrough-r
p_below <- predict(logit_full, newdata = test, type = "response")

flag <- p_below > 0.5
act  <- test$below_good == 1

# one real school nearest each of four illustrative probabilities
pick <- function(sel, target) {
  i <- which(sel); i[which.min(abs(p_below[i] - target))]
}
idx <- c(pick(!flag & !act, 0.03), pick(flag &  act, 0.70),
         pick(!flag &  act, 0.30), pick(flag & !act, 0.60))

data.frame(
  school      = c("A", "B", "C", "D"),
  probability = round(p_below[idx], 2),
  above_0.5   = ifelse(p_below[idx] > 0.5, "yes", "no"),
  predicted   = ifelse(p_below[idx] > 0.5, "Below Good", "Good or better"),
  actual      = ifelse(act[idx], "Below Good", "Good or better"),
  right       = ifelse((p_below[idx] > 0.5) == act[idx], "yes", "no"),
  row.names   = NULL
)
```
#### {width="30"}
```{python}
#| label: walkthrough-py
p_below = logit_full.predict(test)

flag = p_below > 0.5
act  = test["below_good"] == 1

def pick(sel, target):
    return (p_below[sel] - target).abs().idxmin()

idx = [pick(~flag & ~act, 0.03), pick(flag &  act, 0.70),
       pick(~flag &  act, 0.30), pick(flag & ~act, 0.60)]

print(pd.DataFrame({
    "school":      ["A", "B", "C", "D"],
    "probability": p_below[idx].round(2).values,
    "above_0.5":   np.where(p_below[idx] > 0.5, "yes", "no"),
    "predicted":   np.where(p_below[idx] > 0.5, "Below Good", "Good or better"),
    "actual":      np.where(act[idx], "Below Good", "Good or better"),
    "right":       np.where((p_below[idx] > 0.5) == act[idx], "yes", "no"),
}))
```
:::
::: {.callout-note title="What just happened"}
**C** was missed and **D** was a false alarm. Each school is judged on **its
own** probability - the cut-off simply sorts them either side of the line, one
school at a time.
So **0.5 is not "half the time"**. Applied to all 951 test schools it flags 48
of them, not 476.
:::
### 10b - Now count them all
Here is the whole trap in one step. Count how often you were right, and then
count how often you would have been right by **not building a model at all** -
by simply saying "not below Good" to every school.
::: {.multicode}
#### {width="41" height="30"}
```{r}
#| label: accuracy-r
p_below  <- predict(logit_full, newdata = test, type = "response")

accuracy <- mean((p_below > 0.5) == test$below_good)
baseline <- max(mean(test$below_good), 1 - mean(test$below_good))

c(accuracy = round(accuracy, 4), baseline = round(baseline, 4))
```
#### {width="30"}
```{python}
#| label: accuracy-py
p_below = logit_full.predict(test)

accuracy = ((p_below > 0.5).astype(int) == test["below_good"]).mean()
baseline = max(test["below_good"].mean(), 1 - test["below_good"].mean())

print({"accuracy": round(accuracy, 4), "baseline": round(baseline, 4)})
```
:::
::: {.callout-important title="Stop here and look at those two numbers"}
They are **the same**: 0.8686 and 0.8686. Six predictors, a proper model, a
clean train/test split - and it classifies schools **exactly as well as a
rule that ignores the data entirely**.
This is not a mistake in your code. It is what the 15% was always going to do
to us, and it is the most useful result in this practical.
:::
### 10c - That baseline is a model you have already fitted
We worked the baseline out arithmetically - *what share would I get right by
always guessing the commoner answer?* But it is also a **model**: an
intercept and nothing else. R and `statsmodels` will fit it for you.
::: {.multicode}
#### {width="41" height="30"}
```{r}
#| label: nullmodel-r
null_mod <- glm(below_good ~ 1, data = train, family = binomial)
p_null   <- predict(null_mod, newdata = test, type = "response")

c(distinct_predictions = length(unique(round(p_null, 10))),
  it_predicts          = round(unique(p_null)[[1]], 4),
  its_accuracy         = round(mean((p_null > 0.5) == test$below_good), 4),
  our_baseline         = round(baseline, 4))
```
#### {width="30"}
```{python}
#| label: nullmodel-py
null_mod = smf.glm("below_good ~ 1", data=train,
                   family=sm.families.Binomial()).fit()
p_null = null_mod.predict(test)

print({"distinct_predictions": p_null.round(10).nunique(),
       "it_predicts":  round(p_null.iloc[0], 4),
       "its_accuracy": round(((p_null > 0.5).astype(int) == test["below_good"]).mean(), 4),
       "our_baseline": round(baseline, 4)})
```
:::
::: {.callout-note title="Why they are the same number"}
The null model makes **one** distinct prediction - 0.1577, the share of
training schools below Good - for every school in the test set. That is below
0.5, so thresholding sends *every* school to "Good or better", which is
exactly the always-say-no rule. Hence the identical accuracy.
Now compare `null_mod$deviance` with the `null_deviance` you printed back in
Task 9. **They are the same number**, because that is what null deviance
*is*: the deviance of this model. R has been fitting it for you every time you
call `glm()` - you have just never looked at it.
:::
::: {.callout-tip title="Question"}
Would the two still agree if below-Good schools were the **majority** - say
60% of them? Work out what the null model would predict, what thresholding at
0.5 would then do, and what the majority-class baseline would be.
:::
## Task 11 - The confusion matrix shows you why
Accuracy is one number squashed out of four, and the four are more honest.
::: {.multicode}
#### {width="41" height="30"}
```{r}
#| label: confusion-r
table(Actual    = ifelse(test$below_good == 1, "Below Good", "Good or better"),
      Predicted = ifelse(p_below > 0.5,        "Below Good", "Good or better"))
```
#### {width="30"}
```{python}
#| label: confusion-py
print(pd.crosstab(
    test["below_good"].map({1: "Below Good", 0: "Good or better"}),
    pd.Series(np.where(p_below > 0.5, "Below Good", "Good or better"),
              index=test.index),
    rownames=["Actual"], colnames=["Predicted"]))
```
:::
Of the 125 schools that really are below Good, the model flags **24** and
misses **101**. It also raises **24** false alarms. The gains and the losses
cancel exactly, which is why accuracy came out identical to the baseline.
::: {.callout-tip title="Question"}
A school improvement team has to decide where to send inspectors. Which of
the four cells in that table costs them most? Does accuracy weight it that
way?
:::
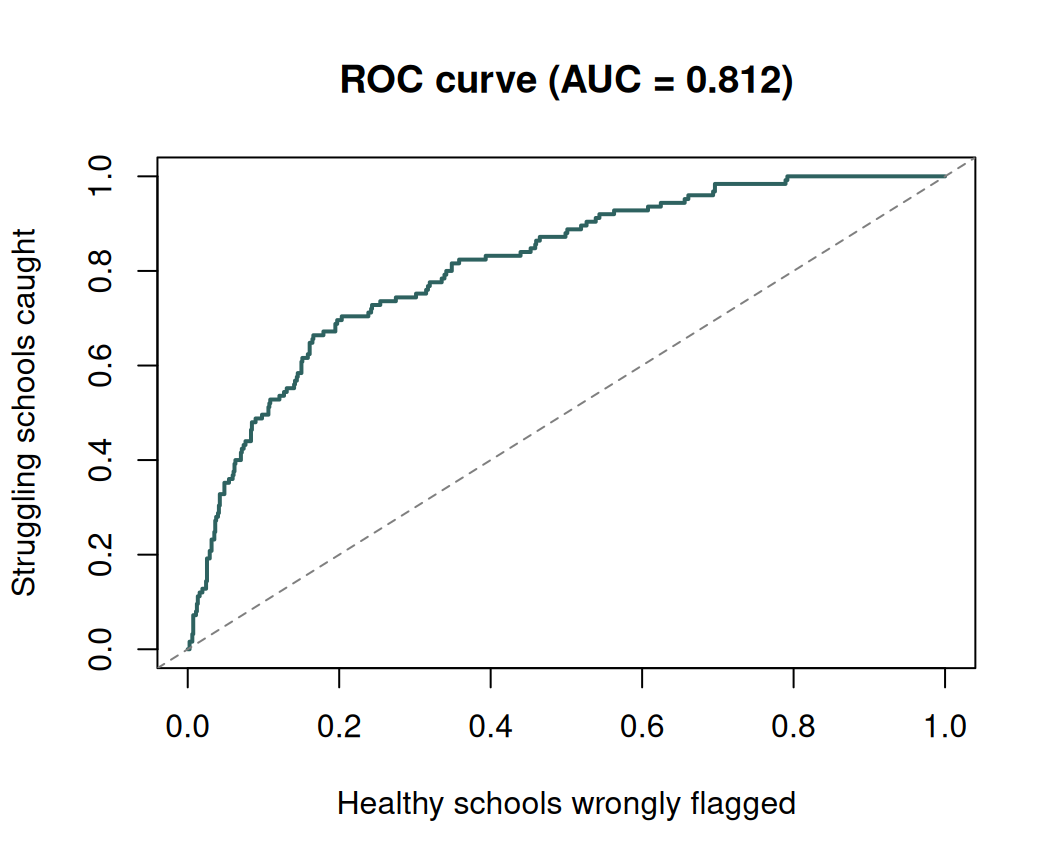
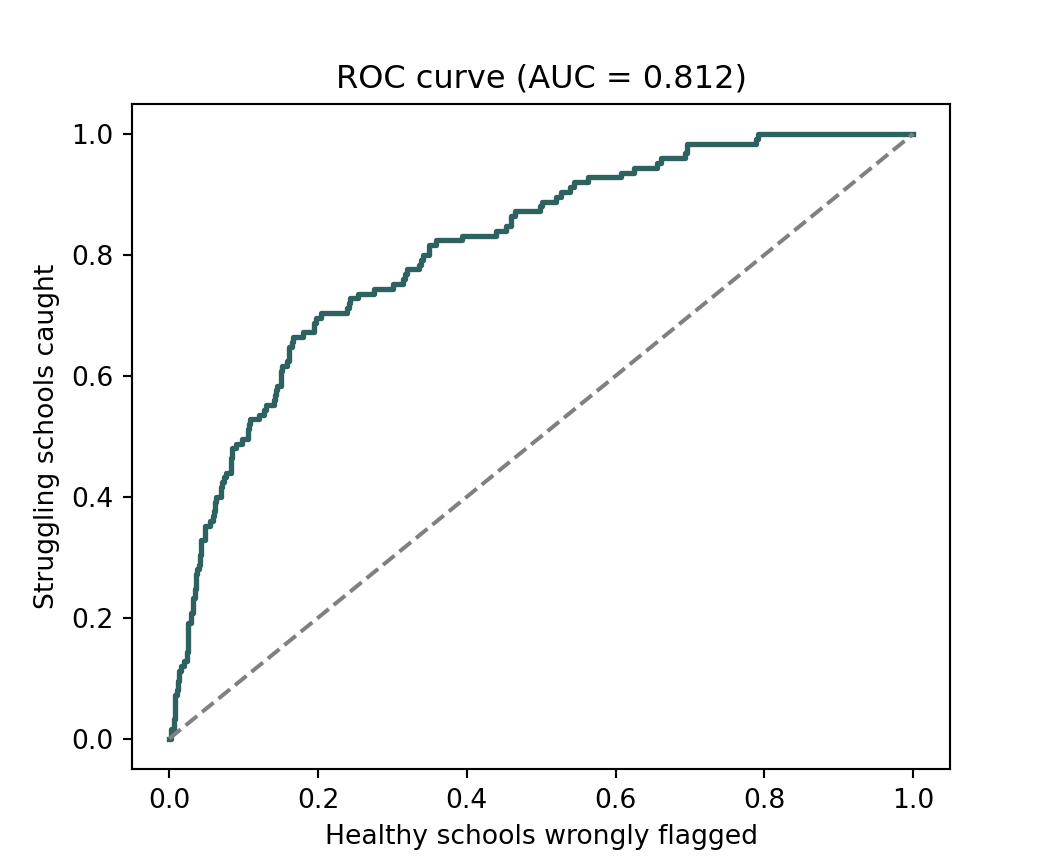
## Task 12 - ROC and AUC: judge the ranking instead
Everything above hung on the cut-off of **0.5**, and nothing made 0.5 right.
So ask a question that does not depend on it at all: does the model put
schools in the right **order**?
**ROC** stands for *Receiver Operating Characteristic*, a name inherited from
WWII radar operators and one that tells you nothing useful. **AUC** is the
*Area Under the Curve*.
::: {.multicode}
#### {width="41" height="30"}
```{r}
#| label: roc-r
#| fig-width: 5.5
#| fig-height: 4.5
roc <- performance::performance_roc(logit_full, new_data = test)
auc <- bayestestR::area_under_curve(roc$Specificity, roc$Sensitivity)
auc
plot(roc$Specificity, roc$Sensitivity, type = "l", lwd = 2, col = "#2E6260",
     xlab = "Healthy schools wrongly flagged",
     ylab = "Struggling schools caught",
     main = paste0("ROC curve (AUC = ", round(auc, 3), ")"))
abline(0, 1, lty = 2, col = "grey50")
```
#### {width="30"}
```{python}
#| label: roc-py
from sklearn.metrics import roc_curve, roc_auc_score

fpr, tpr, thresholds = roc_curve(test["below_good"], p_below)
auc = roc_auc_score(test["below_good"], p_below)
print(round(auc, 4))
fig, ax = plt.subplots(figsize=(5.5, 4.5))
ax.plot(fpr, tpr, lw=2, color="#2E6260")
ax.plot([0, 1], [0, 1], ls="--", color="grey")
ax.set_xlabel("Healthy schools wrongly flagged")
ax.set_ylabel("Struggling schools caught")
ax.set_title(f"ROC curve (AUC = {auc:.3f})")
plt.show()
```
:::
**AUC comes out at 0.812.** Read it like this:
> *Pick one school that really is below Good and one that really is not. The
> model gives the struggling one the higher **predicted probability of being
> below Good** 81% of the time.*
That "predicted probability" is the model's own output - the 0-to-1 number
you called `p_below` - and not Progress 8 or any other predictor.
::: {.callout-important title="Both things are true at once"}
The model classifies no better than doing nothing, **and** it ranks schools
well. There is no contradiction. We were reading a good ranking at a cut-off
that threw the ranking away.
:::
## Task 13 - Now choose a cut-off
Only now that you know the model ranks sensibly is the cut-off a sensible
question - and it is a **policy** question, not a statistical one.
::: {.multicode}
#### {width="41" height="30"}
```{r}
#| label: thresholds-r
thresholds <- c(0.5, 0.3, 0.2, 0.1)

data.frame(
  cut_off      = thresholds,
  caught       = sapply(thresholds, function(t) sum(p_below >  t & test$below_good == 1)),
  missed       = sapply(thresholds, function(t) sum(p_below <= t & test$below_good == 1)),
  false_alarms = sapply(thresholds, function(t) sum(p_below >  t & test$below_good == 0))
)
```
#### {width="30"}
```{python}
#| label: thresholds-py
rows = []
for t in [0.5, 0.3, 0.2, 0.1]:
    flag = p_below > t
    rows.append({"cut_off": t,
                 "caught": int((flag & (test.below_good == 1)).sum()),
                 "missed": int((~flag & (test.below_good == 1)).sum()),
                 "false_alarms": int((flag & (test.below_good == 0)).sum())})
print(pd.DataFrame(rows))
```
:::
::: {.callout-tip title="Question - and it is the one that matters"}
Pick a cut-off and **defend it in two sentences**, naming who bears the cost
of the misses and who bears the cost of the false alarms. There is no correct
answer here, and that is the point: AUC told you the curve was worth picking
from, but it cannot tell you where on it to sit.
:::
# Part 6: Extensions
Two routes out of here. **Pick one** - they are both a solid hour - and come
back for the other if you have time. Extension A connects today to last
week; Extension B connects today to the rest of the GLM family.
## Extension A - Take ROC back to the multilevel model
Last week you fitted a linear mixed effects model with local authority as a
grouping variable. The obvious question is whether you can put a ROC curve on
it.
::: {.callout-warning title="Read this before you try - the honest answer is 'not directly'"}
**You cannot run a ROC curve on last week's model as it stands.** ROC and AUC
need a **binary** outcome: the curve is built by counting how many of the 1s
you caught against how many of the 0s you wrongly flagged, and if the outcome
is a continuous Attainment 8 score there are no 1s and 0s to count.
This is not a technicality to work around. It is the same point as the
callout at the top of Part 5: holding data back and comparing against a
baseline transfer to any model, but **the scoreboard does not**.
So the interesting version of this extension is not "ROC the old model". It
is: **keep the grouping structure, change the outcome to a binary one, and
you get a model that is both of the last two weeks at once** - a generalised
linear *mixed* model.
:::
### A1 - Fit a mixed-effects logistic regression
A random intercept for local authority, on top of the logistic regression you
already have. In R this is `glmer()` - `lmer()` with a `family` argument,
exactly the way `glm()` was `lm()` with a `family` argument.
::: {.multicode}
#### {width="41" height="30"}
```{r}
#| label: glmm-r
library(lme4)

glmm <- glmer(below_good ~ P8MEA + PTFSM6CLA1A + PERCTOT + (1 | LANAME),
              data = train, family = binomial)

summary(glmm)
# How much do local authorities differ, once the predictors are accounted for?
VarCorr(glmm)
```
#### {width="30"}
```{python}
#| label: glmm-py
from statsmodels.genmod.bayes_mixed_glm import BinomialBayesMixedGLM

glmm = BinomialBayesMixedGLM.from_formula(
    "below_good ~ P8MEA + PTFSM6CLA1A + PERCTOT",
    {"LANAME": "0 + C(LANAME)"},
    train).fit_vb(verbose=False)

print(glmm.summary())
```
:::
::: {.callout-note title="A real difference between the two languages"}
This is the one place in the practical where the tabs do **not** give you the
same numbers, and you should know why.
`glmer()` fits by maximum likelihood. statsmodels' `BinomialBayesMixedGLM`
fits by **variational Bayes** - a different estimator of a differently
specified model - so the coefficients land close but not identical, and the
summary reports posterior means rather than estimates and standard errors.
The local authority standard deviation comes out at about **0.43** from
`glmer()` and **0.45** from statsmodels - close enough that the conclusion is
the same either way, which is the point.
Python's mixed-model support is genuinely thinner than R's - and you will
feel it in A2, where there is no `predict()` that takes new data *and* the
random effects, so we rebuild the linear predictor by hand. If you need
mixed models seriously in Python, `pymer4` (which calls lme4 underneath) and
`bambi` are the usual answers.
:::
### A2 - Did the grouping actually help the ranking?
Here is where today's scoreboard earns its keep. Fit the same model **without**
the random intercept, predict both on the held-out schools, and compare AUC.
::: {.multicode}
#### {width="41" height="30"}
```{r}
#| label: glmm-roc-r
flat <- glm(below_good ~ P8MEA + PTFSM6CLA1A + PERCTOT,
            data = train, family = binomial)

auc_of <- function(scores, actual) {
  r  <- rank(scores)
  n1 <- sum(actual == 1); n0 <- sum(actual == 0)
  (sum(r[actual == 1]) - n1 * (n1 + 1) / 2) / (n1 * n0)
}

p_glmm <- predict(glmm, newdata = test, type = "response",
                  allow.new.levels = TRUE)
p_flat <- predict(flat, newdata = test, type = "response")

c(mixed = round(auc_of(p_glmm, test$below_good), 4),
  flat  = round(auc_of(p_flat, test$below_good), 4))
```
#### {width="30"}
```{python}
#| label: glmm-roc-py
import patsy
from sklearn.metrics import roc_auc_score

# statsmodels has no predict() that takes new data *and* the random effects,
# so we rebuild the linear predictor by hand: fixed part + this school's
# local-authority effect.
X_test = patsy.dmatrix("P8MEA + PTFSM6CLA1A + PERCTOT", test, return_type="dataframe")
eta    = X_test.values @ glmm.fe_mean

re_mean = glmm.random_effects()["Mean"]
re_map  = {k.split("[")[1].rstrip("]"): v for k, v in re_mean.items()}
# .fillna(0) is this language's allow.new.levels: an unseen authority
# simply gets the average intercept
eta += test["LANAME"].map(re_map).fillna(0.0).values

p_glmm = 1 / (1 + np.exp(-eta))

flat   = smf.glm("below_good ~ P8MEA + PTFSM6CLA1A + PERCTOT",
                 data=train, family=sm.families.Binomial()).fit()
p_flat = flat.predict(test)

print({"mixed": round(roc_auc_score(test["below_good"], p_glmm), 4),
       "flat":  round(roc_auc_score(test["below_good"], p_flat),  4)})
```
:::
```{r}
#| label: a2-numbers
#| echo: false
auc_mixed <- auc_of(p_glmm, test$below_good)
auc_flat <- auc_of(p_flat, test$below_good)
la_sd <- attr(lme4::VarCorr(glmm)$LANAME, "stddev")[[1]]
n_la <- dplyr::n_distinct(train$LANAME)
```
::: {.callout-note title="The two languages will not quite agree, and that is expected"}
R gets a mixed-model AUC of **`r sprintf("%.4f", auc_mixed)`**; Python gets
about **0.8154**. The *flat* models agree exactly, because both are ordinary
`glm()` fits - the difference is entirely in the mixed model, where `glmer()`
maximises the likelihood and statsmodels runs variational Bayes. Close, not
identical, and for the same reason the coefficients differed in A1.
:::
::: {.callout-tip title="Question - and do not assume the answer"}
The mixed model gets **`r sprintf("%.4f", auc_mixed)`**; the flat one gets
**`r sprintf("%.4f", auc_flat)`**. Modelling `r n_la` local authorities bought
you **`r sprintf("%.3f", auc_mixed - auc_flat)` of AUC**.
1. Was the random intercept worth it? Answer for an *explanatory* aim and
for a *predictive* aim separately - the honest answers differ.
2. `allow.new.levels = TRUE` - and `.fillna(0)` in the Python - is doing
something specific when a test-set school sits in a local authority the
training set never saw. What? And why does that limit how much a
group-level model can ever buy you on held-out data?
3. The LA standard deviation is `r sprintf("%.2f", la_sd)` on the log-odds
scale, which is not nothing. How can there be real variation between
authorities and almost no gain in ranking?
:::
## Extension B - A different family: counts, offsets and the negative binomial
Same recipe, different member of the family. Here the outcome is a **count**:
how many schools in each local authority are rated below Good?
### B1 - Build the counts
::: {.multicode}
#### {width="41" height="30"}
```{r}
#| label: la-r
la <- model_data |>
  group_by(LANAME) |>
  summarise(n_below   = sum(below_good),
            n_schools = n(),
            mean_fsm  = mean(PTFSM6CLA1A),
            mean_abs  = mean(PERCTOT),
            .groups   = "drop") |>
  filter(n_schools >= 5)

nrow(la)
summary(la$n_below)
```
#### {width="30"}
```{python}
#| label: la-py
la = (model_data
      .groupby("LANAME")
      .agg(n_below=("below_good", "sum"),
           n_schools=("below_good", "size"),
           mean_fsm=("PTFSM6CLA1A", "mean"),
           mean_abs=("PERCTOT", "mean"))
      .reset_index())
la = la[la["n_schools"] >= 5]

print(len(la))
print(la["n_below"].describe())
```
:::
### B2 - Poisson regression, with an offset
An authority with 60 schools will have more schools below Good than one with
8, for reasons that have nothing to do with poverty or absence. The **offset**
is how you tell the model to work in rates rather than raw counts: it is a
predictor whose coefficient is fixed at 1 rather than estimated.
::: {.multicode}
#### {width="41" height="30"}
```{r}
#| label: poisson-r
pois <- glm(n_below ~ mean_fsm + mean_abs + offset(log(n_schools)),
            data = la, family = poisson)

summary(pois)
```
#### {width="30"}
```{python}
#| label: poisson-py
pois = smf.glm("n_below ~ mean_fsm + mean_abs",
               data=la, family=sm.families.Poisson(),
               offset=np.log(la["n_schools"])).fit()

print(pois.summary())
```
:::
::: {.callout-tip title="Question"}
Fit it again **without** the offset and compare the coefficients. Which one
changes most, and can you explain why in terms of what the offset was
soaking up?
:::
### B3 - Is it overdispersed?
The Poisson model assumes the variance equals the mean. That is a strong
assumption and it is usually wrong. Check it before you believe any of the
standard errors.
::: {.multicode}
#### {width="41" height="30"}
```{r}
#| label: dispersion-r
sum(residuals(pois, type = "pearson")^2) / df.residual(pois)
```
#### {width="30"}
```{python}
#| label: dispersion-py
print(pois.pearson_chi2 / pois.df_resid)
```
:::
You should get **1.247**. A value of 1 is what Poisson assumes; much above 2
and the Poisson standard errors are badly optimistic. 1.25 is mild.
### B4 - Fit the negative binomial anyway, and decide whether it was needed
The negative binomial adds one parameter that lets the variance exceed the
mean. Fit it, and then make it earn its place.
::: {.multicode}
#### {width="41" height="30"}
```{r}
#| label: nb-r
nb <- MASS::glm.nb(n_below ~ mean_fsm + mean_abs + offset(log(n_schools)),
                   data = la)

c(poisson_AIC = round(AIC(pois), 1),
  nb_AIC      = round(AIC(nb), 1),
  theta       = round(nb$theta, 2))
```
#### {width="30"}
```{python}
#| label: nb-py
nb = smf.negativebinomial("n_below ~ mean_fsm + mean_abs",
                          data=la, offset=np.log(la["n_schools"])).fit(disp=0)

print({"poisson_AIC": round(pois.aic, 1),
       "nb_AIC": round(nb.aic, 1),
       "alpha": round(nb.params["alpha"], 4)})
```
:::
::: {.callout-important title="The result you were probably not expecting"}
Poisson AIC **573.5**, negative binomial AIC **572.4**. One AIC point, for a
whole extra parameter.
R reports `theta = 19.72` and Python reports `alpha = 0.0507`. They are the
same number: alpha is 1/theta. A **large** theta - equivalently an alpha near
zero - means the negative binomial has collapsed back towards the Poisson,
because there was barely any extra dispersion for it to model.
**The negative binomial was not needed here.** That is a perfectly good
finding, and far more useful than reaching for the fancier model by reflex.
Report the dispersion statistic, report that you checked, and keep the simpler
model.
:::
::: {.callout-tip title="Question"}
Now go and find a count outcome in the DfE files that **is** badly
overdispersed, and run the same four steps on it. Pupil destinations is a good
hunting ground. What would you have got wrong if you had trusted the Poisson
standard errors?
:::
# Where this goes in your assessment
Three habits from today are worth carrying into the coursework, whatever
model you end up fitting:
1. **Look at the outcome before choosing the model.** Binary, count,
proportion, ordered category and continuous each have a family that fits
them. Picking the family is a modelling decision you should justify in a
sentence, not a default you fell into.
2. **Never report accuracy without the baseline beside it.** Today's model
scored 86.9%, which sounds respectable until you notice that doing
nothing also scores 86.9%.
3. **Say what you are for.** If you are *explaining*, judge the model on the
data you fitted it to and interpret the coefficients. If you are
*predicting*, hold data back and judge it there. Both are legitimate.
Deciding which one you are doing **before** you start changes what counts
as a good model, and a write-up that quietly switches between them is the
commonest way to overclaim.