Descriptive statistics: mean, median, variance, standard deviation
Making things comparable: counts, rates and standard scores
Missing data and outliers
This week
Last week was largely descriptive, this week we go a bit deeper!
Last week we talked about histogram’s, this week we’ll look at probability distributions. These are functions with parameters, that you can compute and predict with.
We’ll look at how data can be processed to make it easier to analyse.
Last week you considered what the population of interest was, this week we will consider different sources of data bias.
Learning objectives
By the end of this lecture you should be able to:
Describe the characteristic features of common probability distributions
Apply exponentials and logarithms to transform data
A mathematical function that describes the likelihood of different events occuring in a random process.
More sophisticated than descriptive statistics, probability distributions allow us to mathematically approximate the processes which generated the data.
Continuous vs. Discrete
How we measure data is important for how we model and analyse it.
Continuous
Measurable data which can take any value within a given range.
Discrete
Measurable data which can take seperate, countable values.
Quiz
Is this data continuous or discrete?
The air temperature on the platform at Warren Street
The number of tubes arriving at the platform in the next 10 minutes
The distance commuters travel to work
How late a train is, as recorded in the TfL delay log (whole minutes)
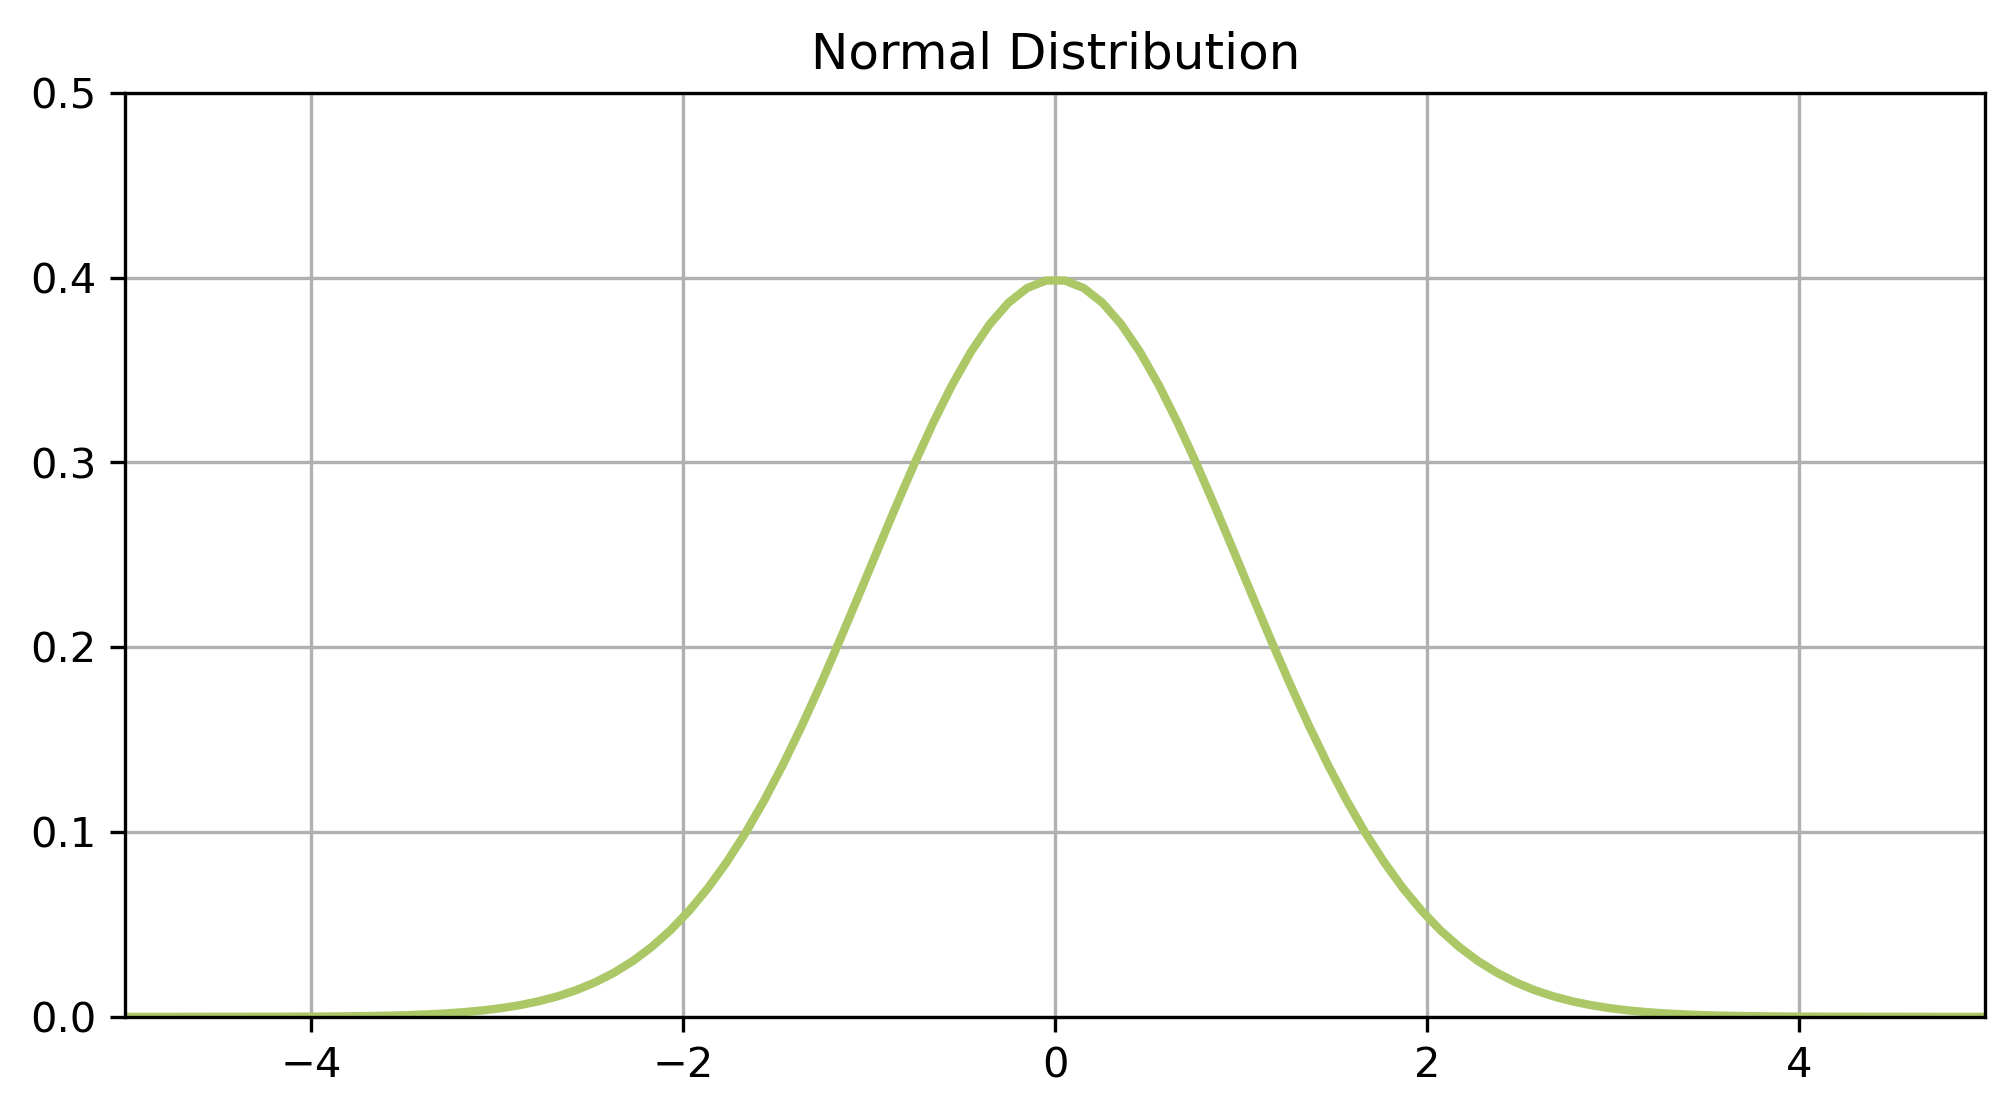
The probability function
\[\begin{align}
p(x)
\end{align}\]
Having a function for the distribution allows us to evaluate the probability of events, and hence (spoiler alert for lecture 3) evaluate hypotheses.
continuous distributions -> probability density functions (PDFs)
discrete distributions -> probability mass functions (PMFs)
Key distributions
Normal
Binomial
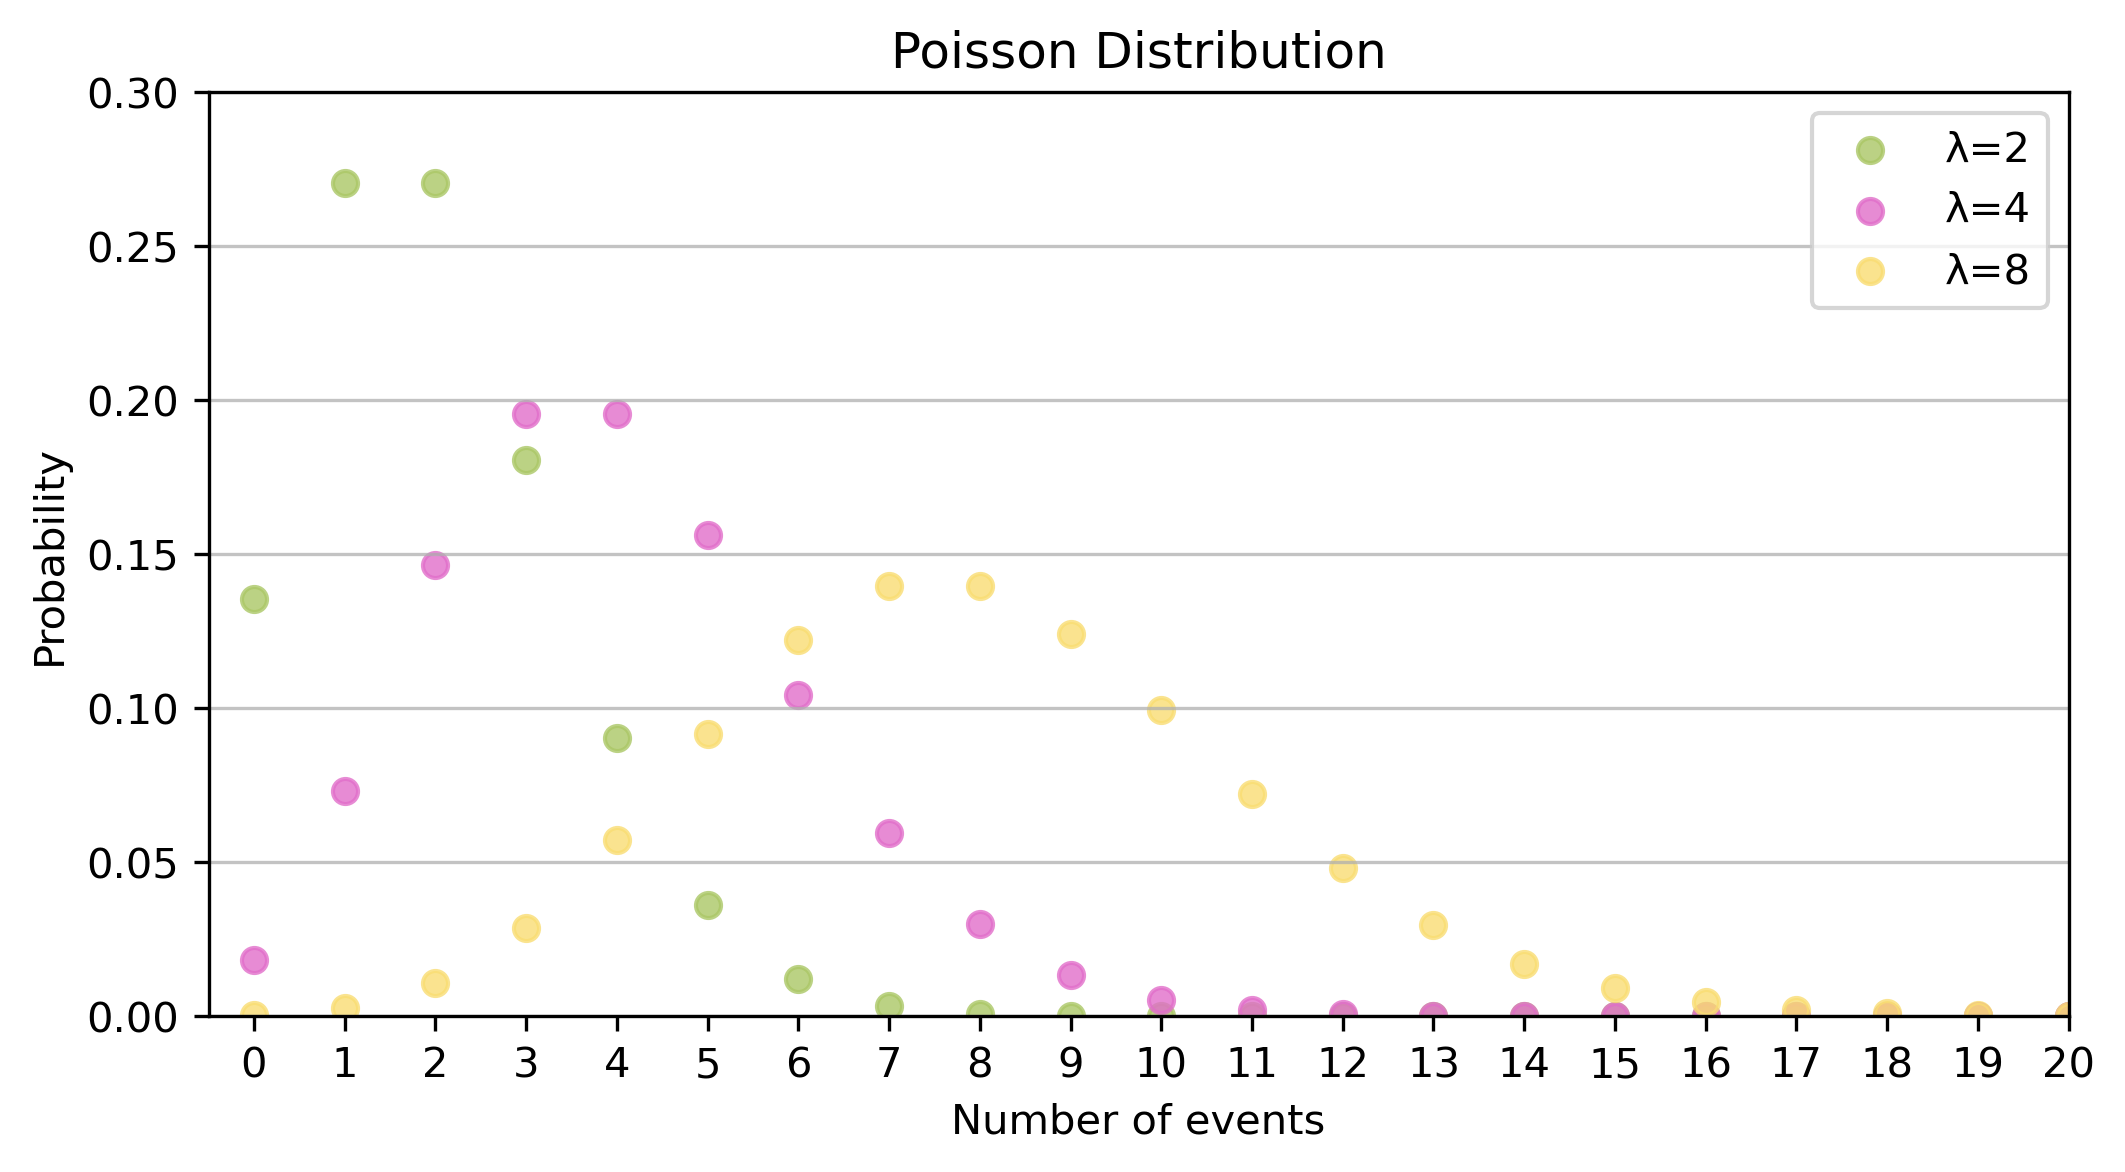
Poisson
Exponential
Type
Continuous
Discrete
Discrete
Continuous
Shape
Symmetric, one peak
Depends on \(p\); symmetric if \(p=0.5\)
Right-skewed (more symmetric as \(\lambda\) grows)
Right-skewed, highest at zero
Parameters
\(\mu\), \(\sigma\)
\(n\), \(p\)
\(\lambda\)
\(\lambda\)
Probability function
PDF
PMF
PMF
PDF
Normal distribution
The most fundamental distribution
Key features
Data is continuous
it is something you measure not something you count
It is symmetric
data is equally likely to be larger or smaller than average
It has a characteristic size
there is a single peak, with all data points close to the mean
There are smooth tails
there is less data further away from the mean
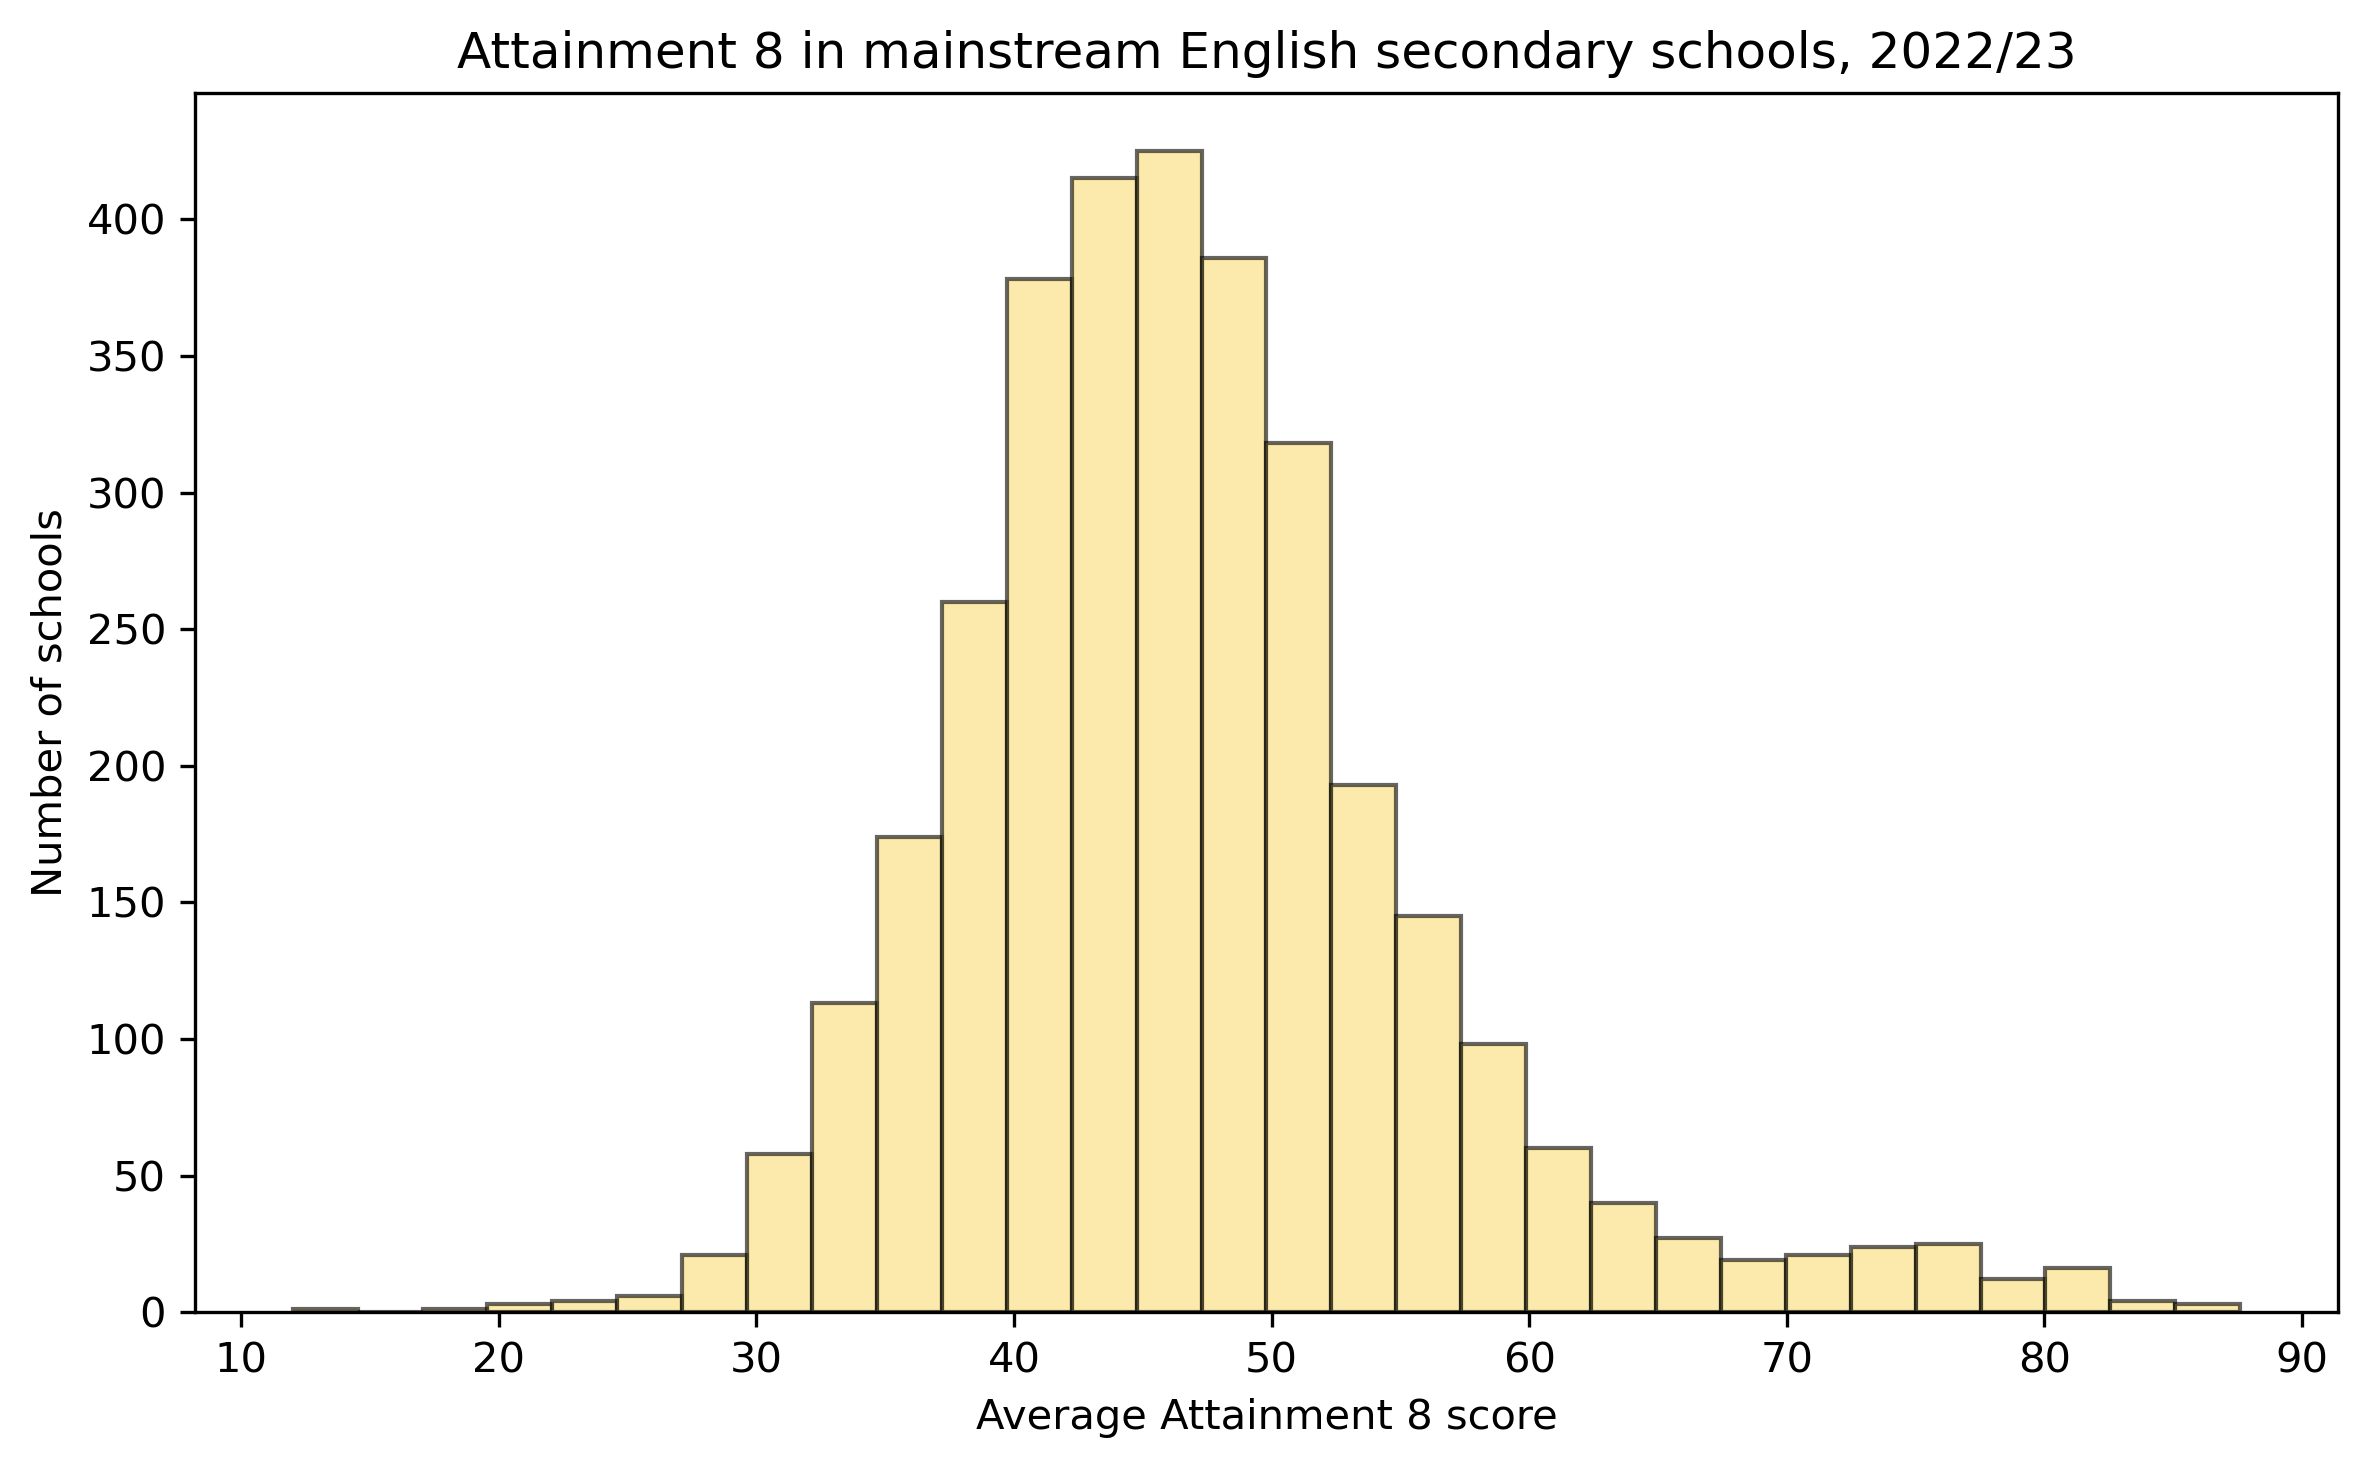
See it in histograms
Approximately normal
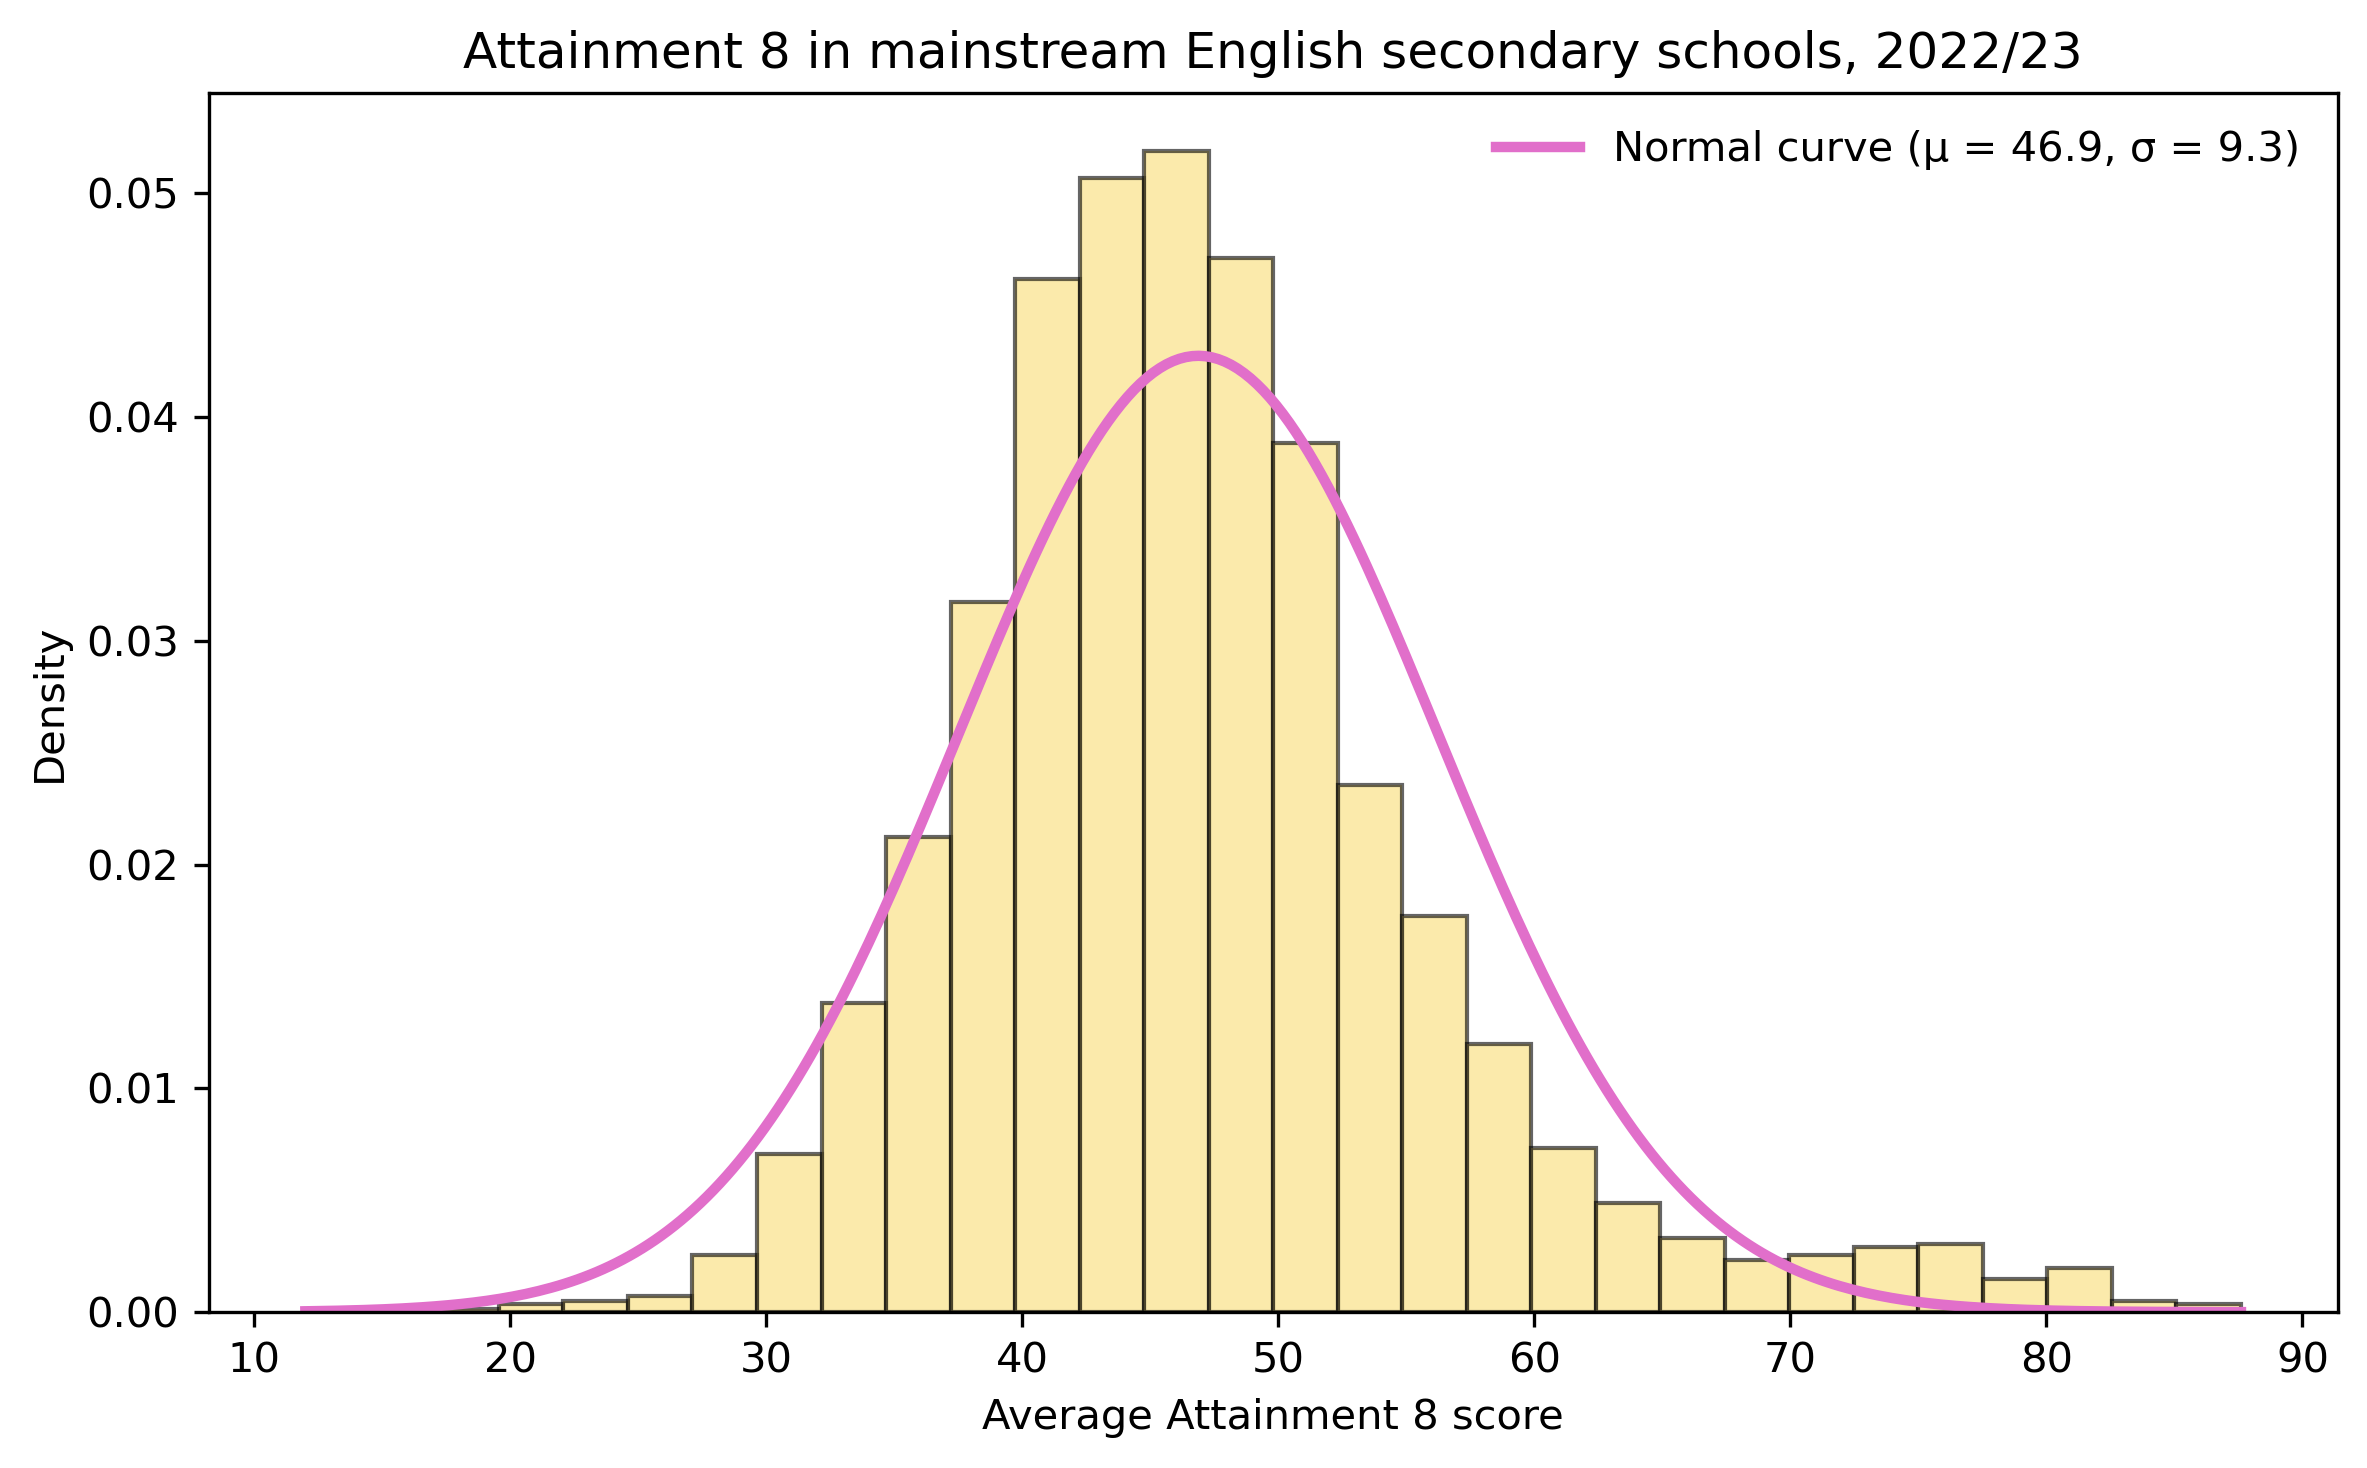
Uniquely described by two variables…
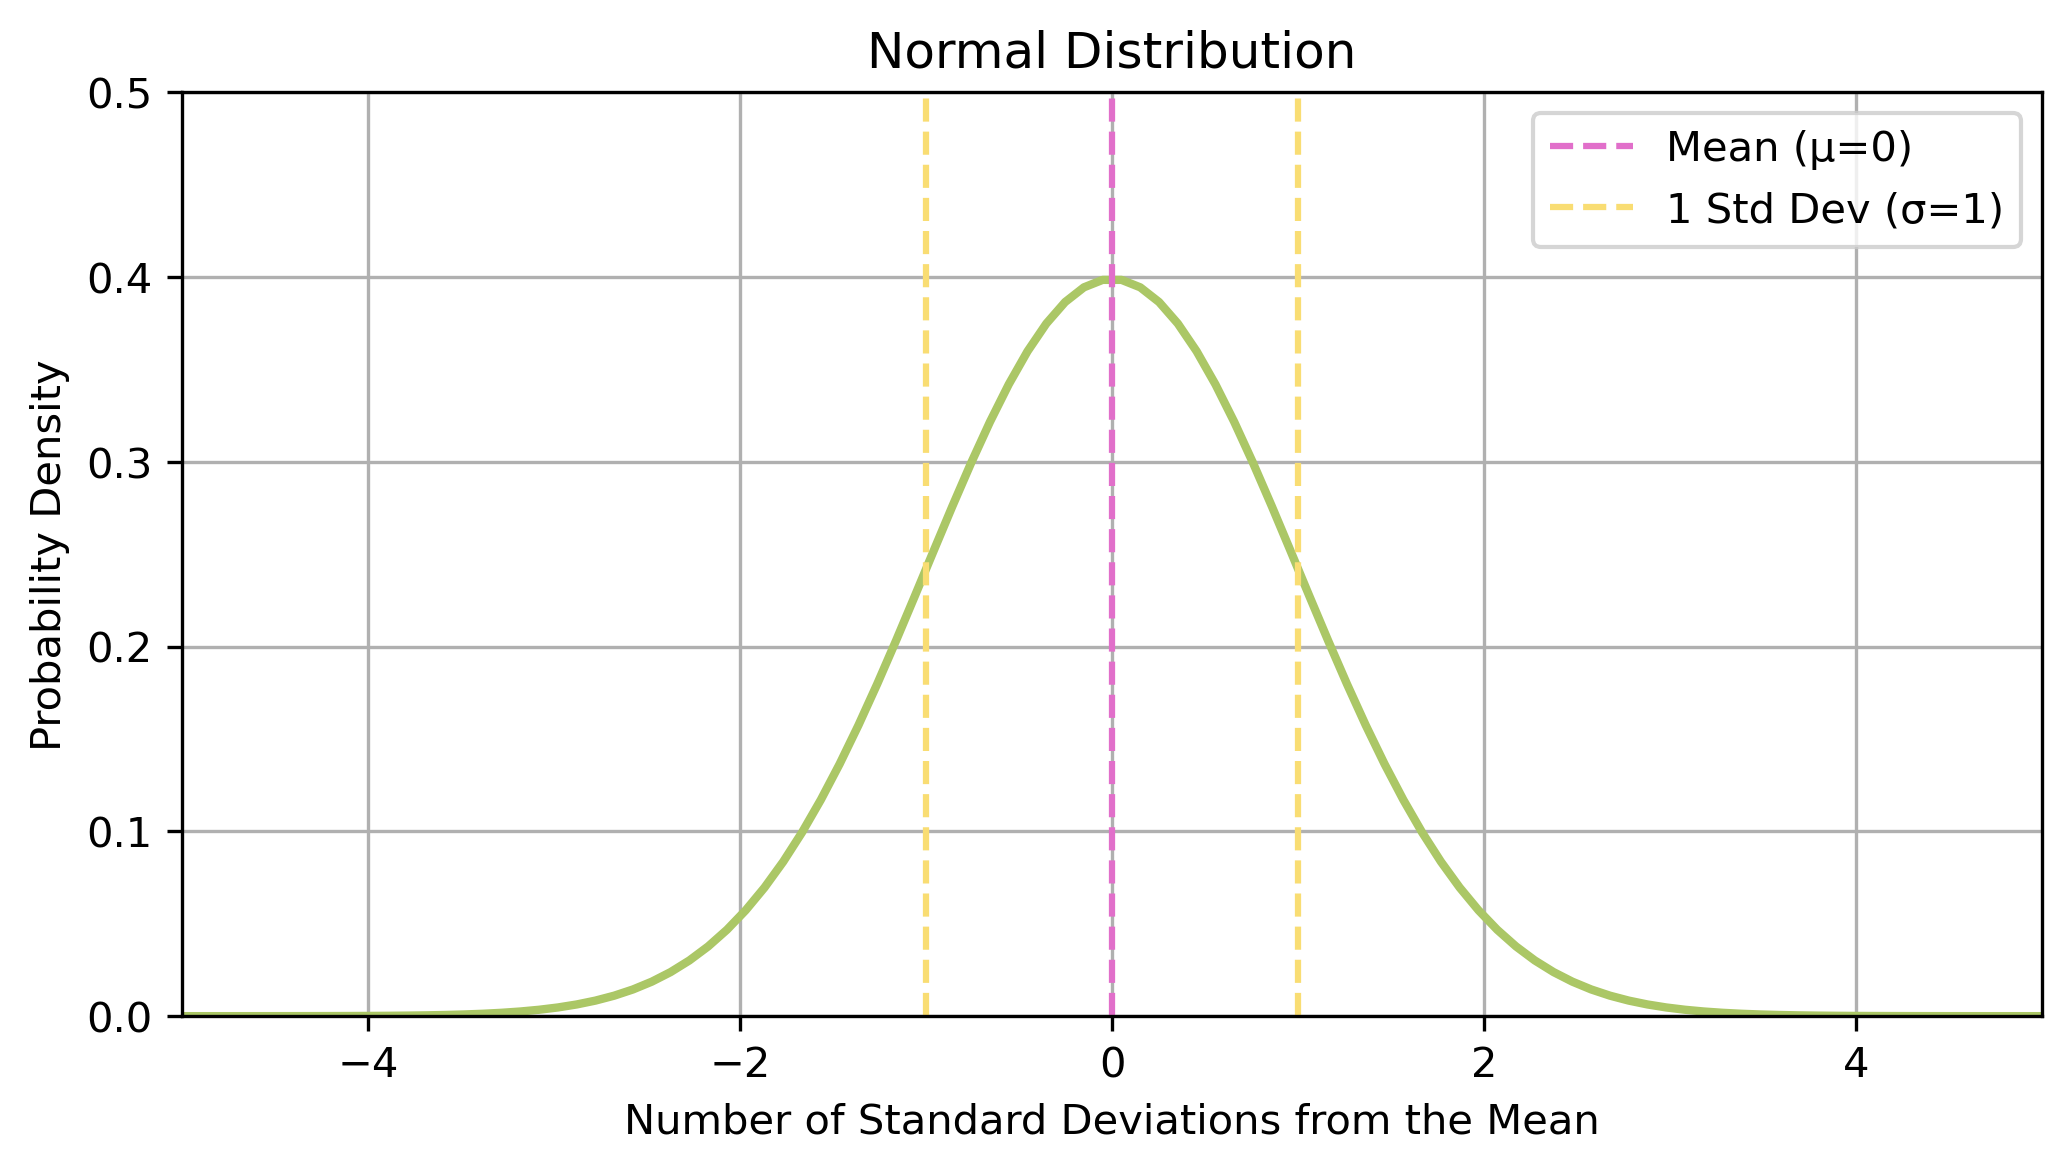
…and a probability density function
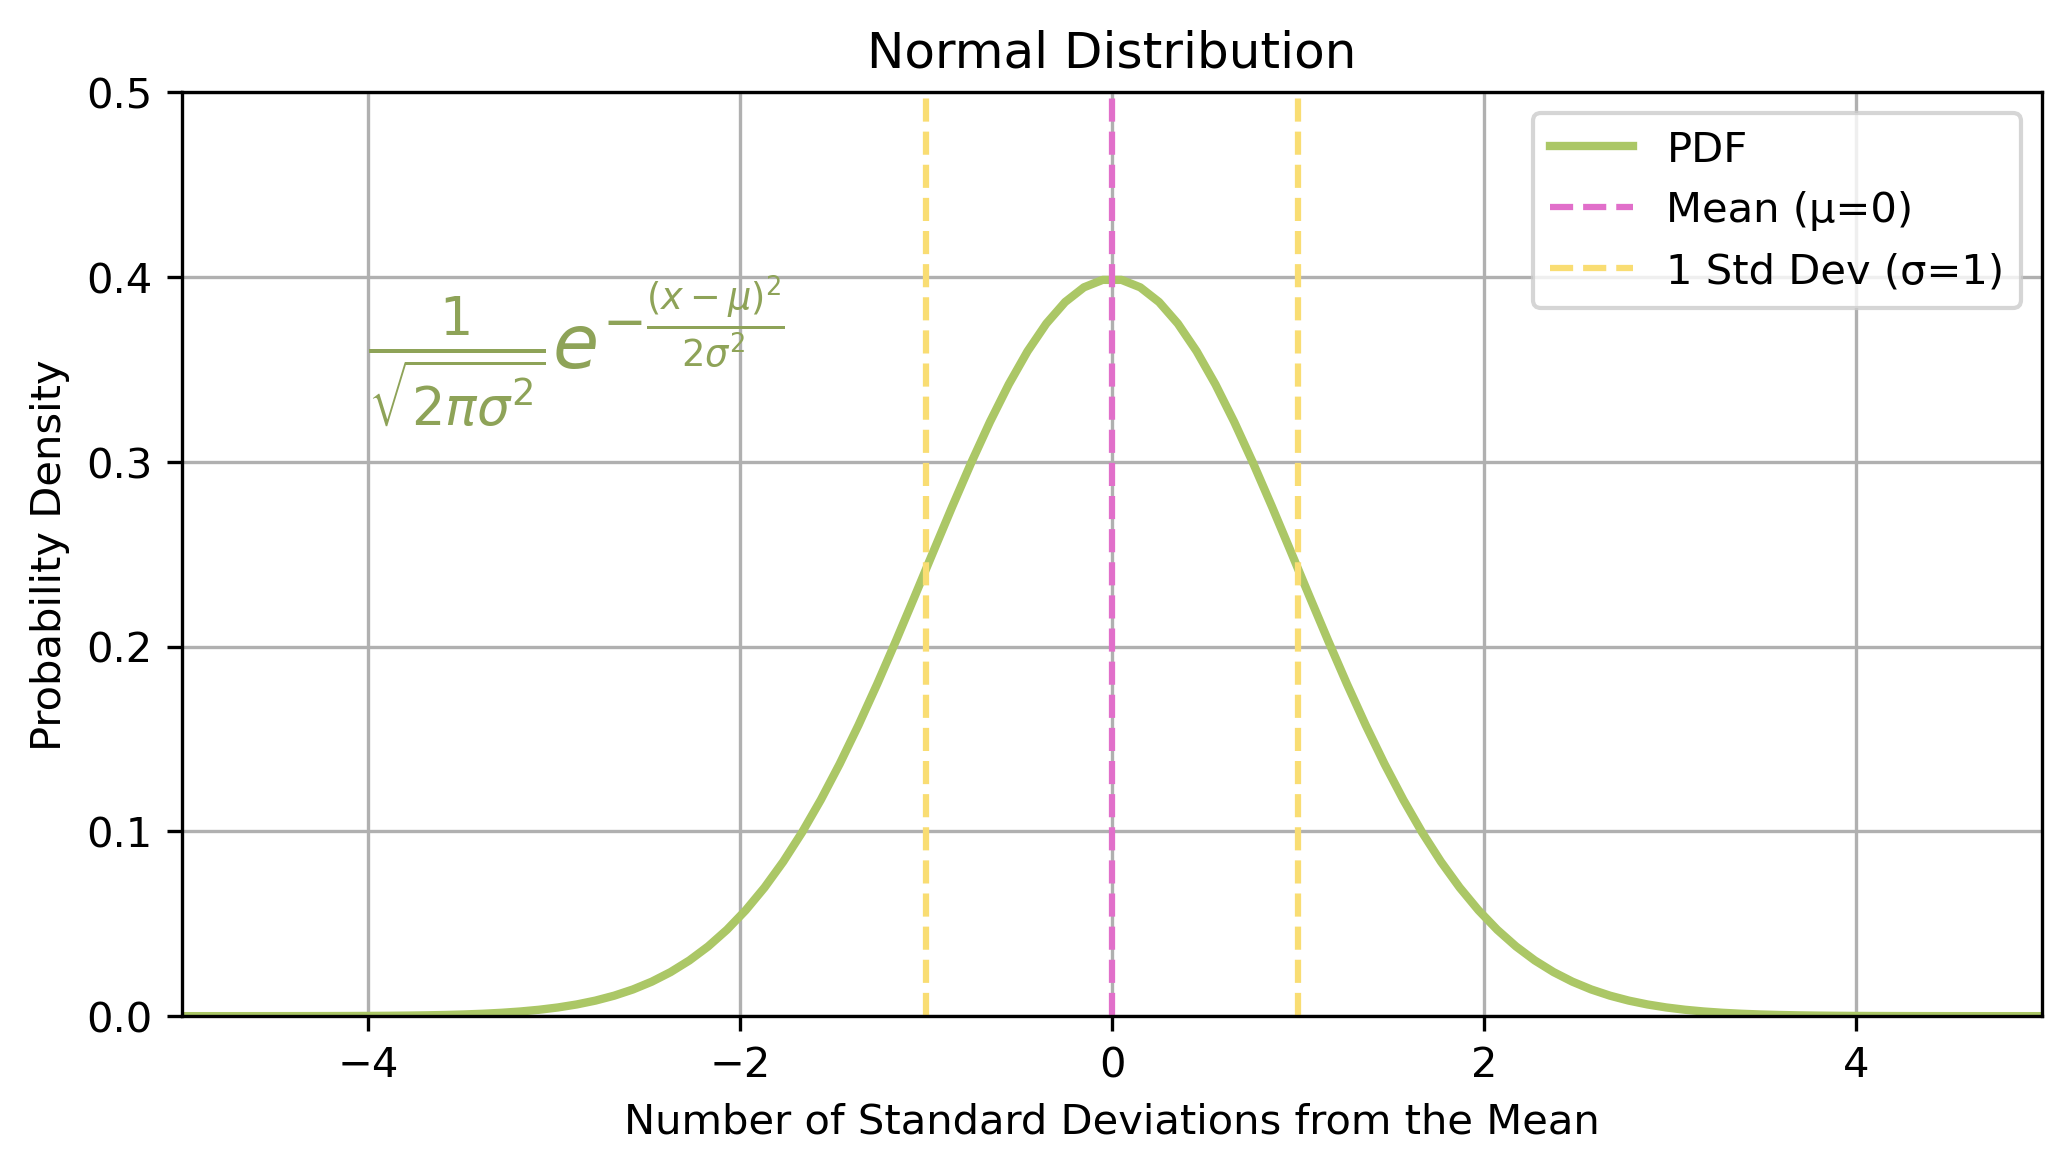
The probability density function (PDF) describes the likelihood of different outcomes for a continuous random variable
A note on samples
When we talk about a distribution, we are usually referring to the population distribution. However, in practice, we often only have a sample from the population.
The standard deviation of the whole population is \(\sigma\):
Bessel’s correction refers to the adjustment made when calculating the standard deviation of a sample.
Intuiiviely, we expect the sample standard deviation to be a bit smaller than the whole population standard deviation, as we have less information about the population. We correct for this by dividing by n-1 instead of n. This correction makes the estimate a bit larger, and hence more accurate.
Random variable
A random variable is a way to map the outcome of a random process to a probability.
In mathematical notation, if a random variable \(X\) is approximately normally distributed about a mean of \(\mu\) with a standard deviation of \(\sigma\) we write:
\[\begin{align}
X \sim N(\mu,\sigma)
\end{align}\]
Calculating probabilities
Can use the PDF to evaluate the probability at a specific point.
Where \(\lambda\) is the expected number of events in a given interval.
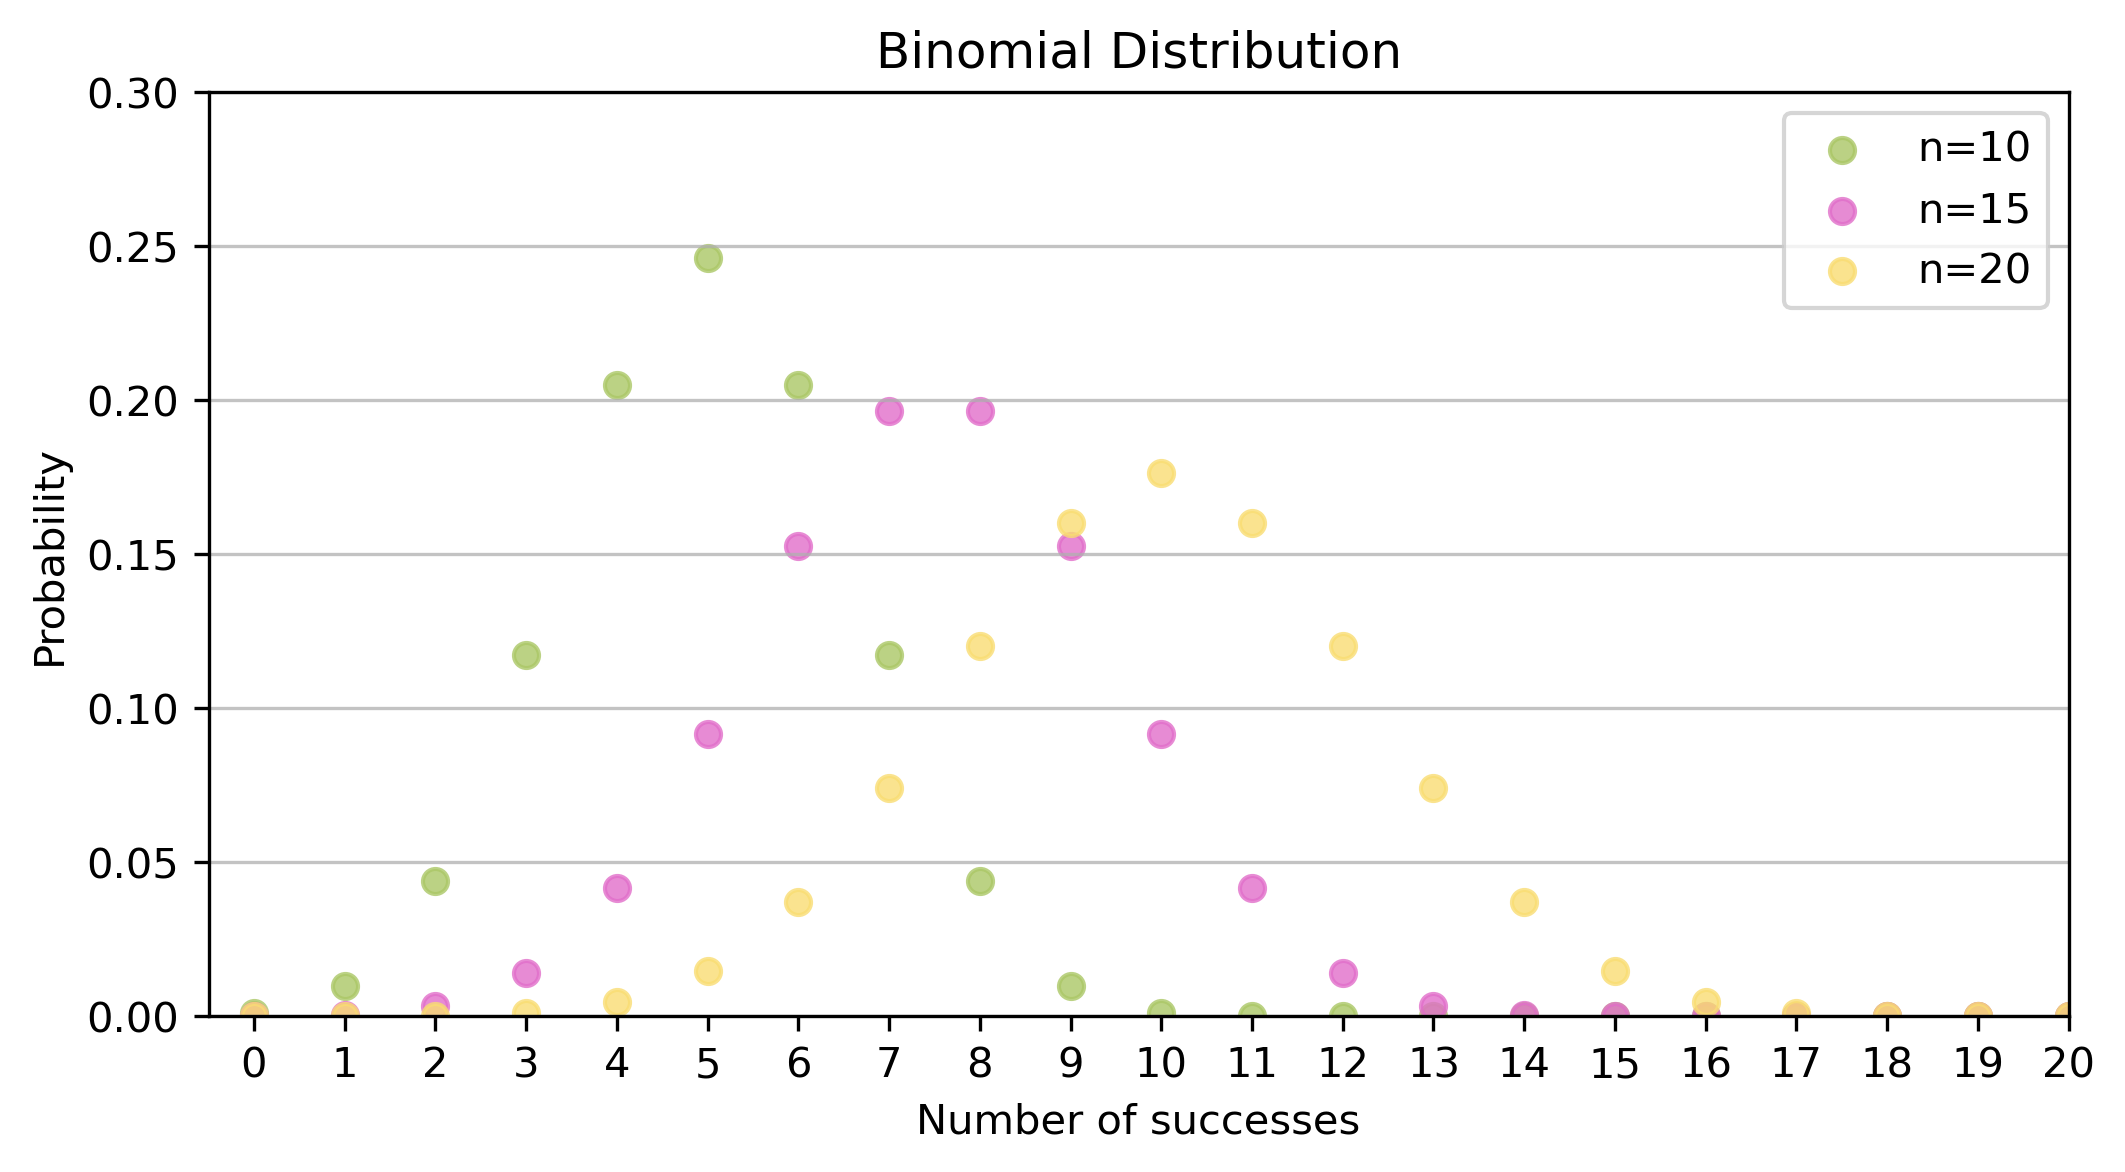
Plotting the distribution
Example 1: bike-share arrivals
A docking station receives on average 0.5 Lime bikes per minute
How likely is it that no bikes arrive in the next 10 minutes?
How likely is it that 8 or more bikes arrive?
from scipy.stats import poissonlambda_10min =0.5*10# expected arrivals in 10 minutesp_no_arrivals = poisson.pmf(0, mu=lambda_10min)p_8_or_more_arrivals = poisson.sf(7, mu=lambda_10min)print("Probability of no arrivals: {}".format(round(p_no_arrivals, 4)))print("Probability of 8 or more arrivals: {}".format(round(p_8_or_more_arrivals, 4)))
Probability of no arrivals: 0.0067
Probability of 8 or more arrivals: 0.1334

Timmy C found a bike in time.
Example 2: trees in a forest
London Plane trees are randomly distirbuted in London’s parks, with an average of 2 trees per 100m².
What is the probability of finding exactly 3 trees in a 100m² area of Hyde Park?

from scipy.stats import poissonlambda_trees =2# expected trees in 100m²p_3_trees = poisson.pmf(3, mu=lambda_trees)print("Probability of finding exactly 3 trees: {}".format(round(p_3_trees, 4)))
Probability of finding exactly 3 trees: 0.1804
A London Plane tree in Wandsworth Park.
Exponentials and Logarithms
Exponentials
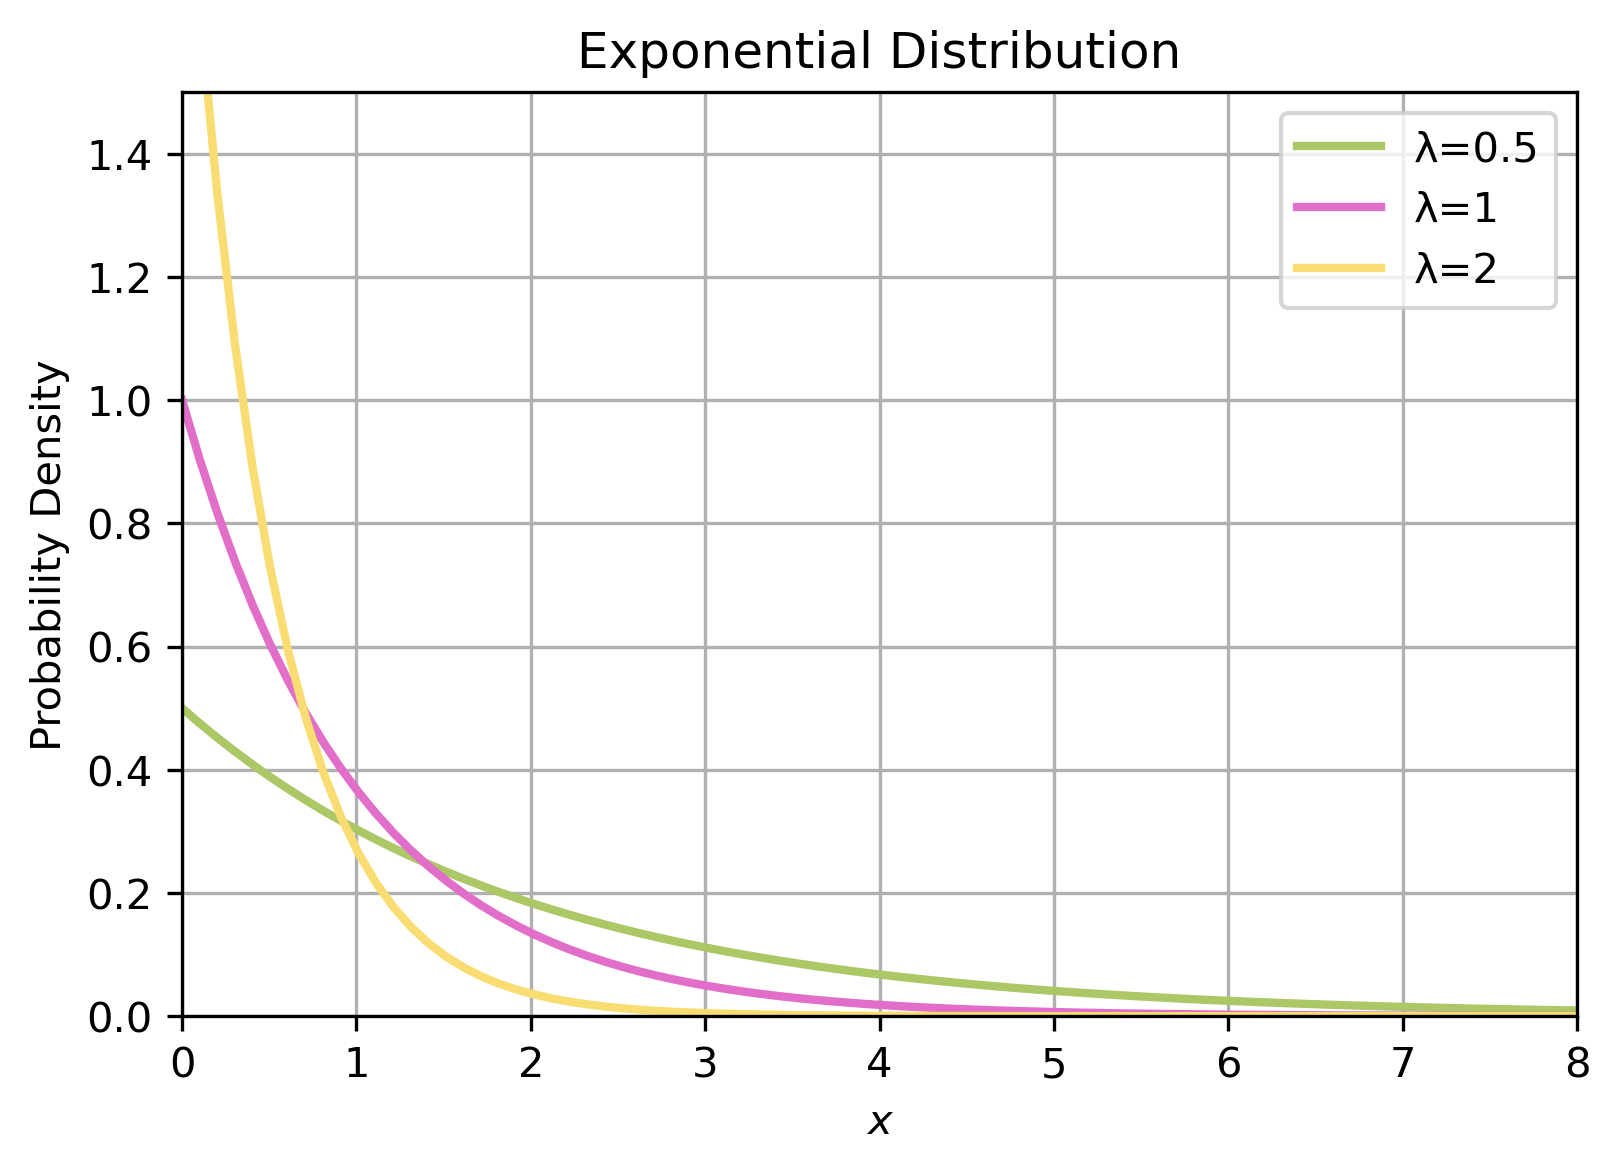
If the Poisson measures the probability of \(x\) events within a time period, then the exponential measures how long we are likely to wait between events.
So what is the exponential function?
“The greatest shortcoming of the human race is our inability to understand the exponential function” – Albert Bartlett (physicist)
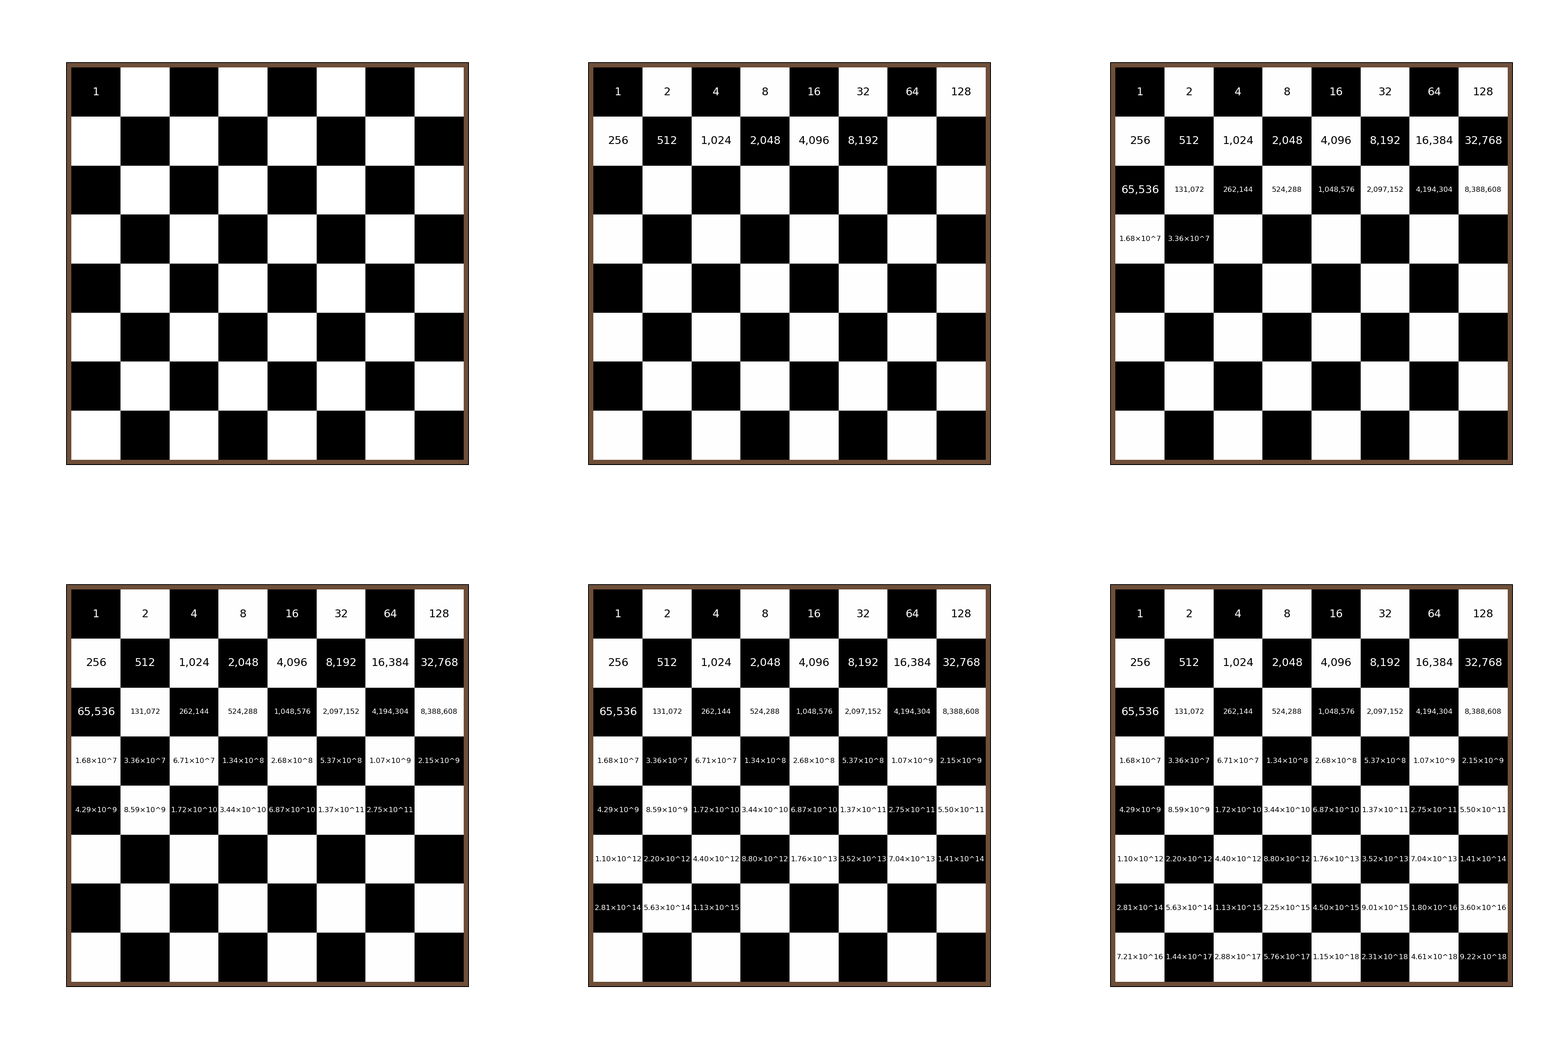
A game of chess…
A scholar has invented chess
The emperor is really grateful and asks the scholar to choose a gift in recompense
The scholar asks for grains of rice
Specifically, rice to fill the chessboard, such that the number of grains double on each square

Krishna and Radha playing chaturanga - the precursor to chess. Image credit: https://en.wikipedia.org/wiki/Chaturanga
…and rice
What does this look like on a graph?
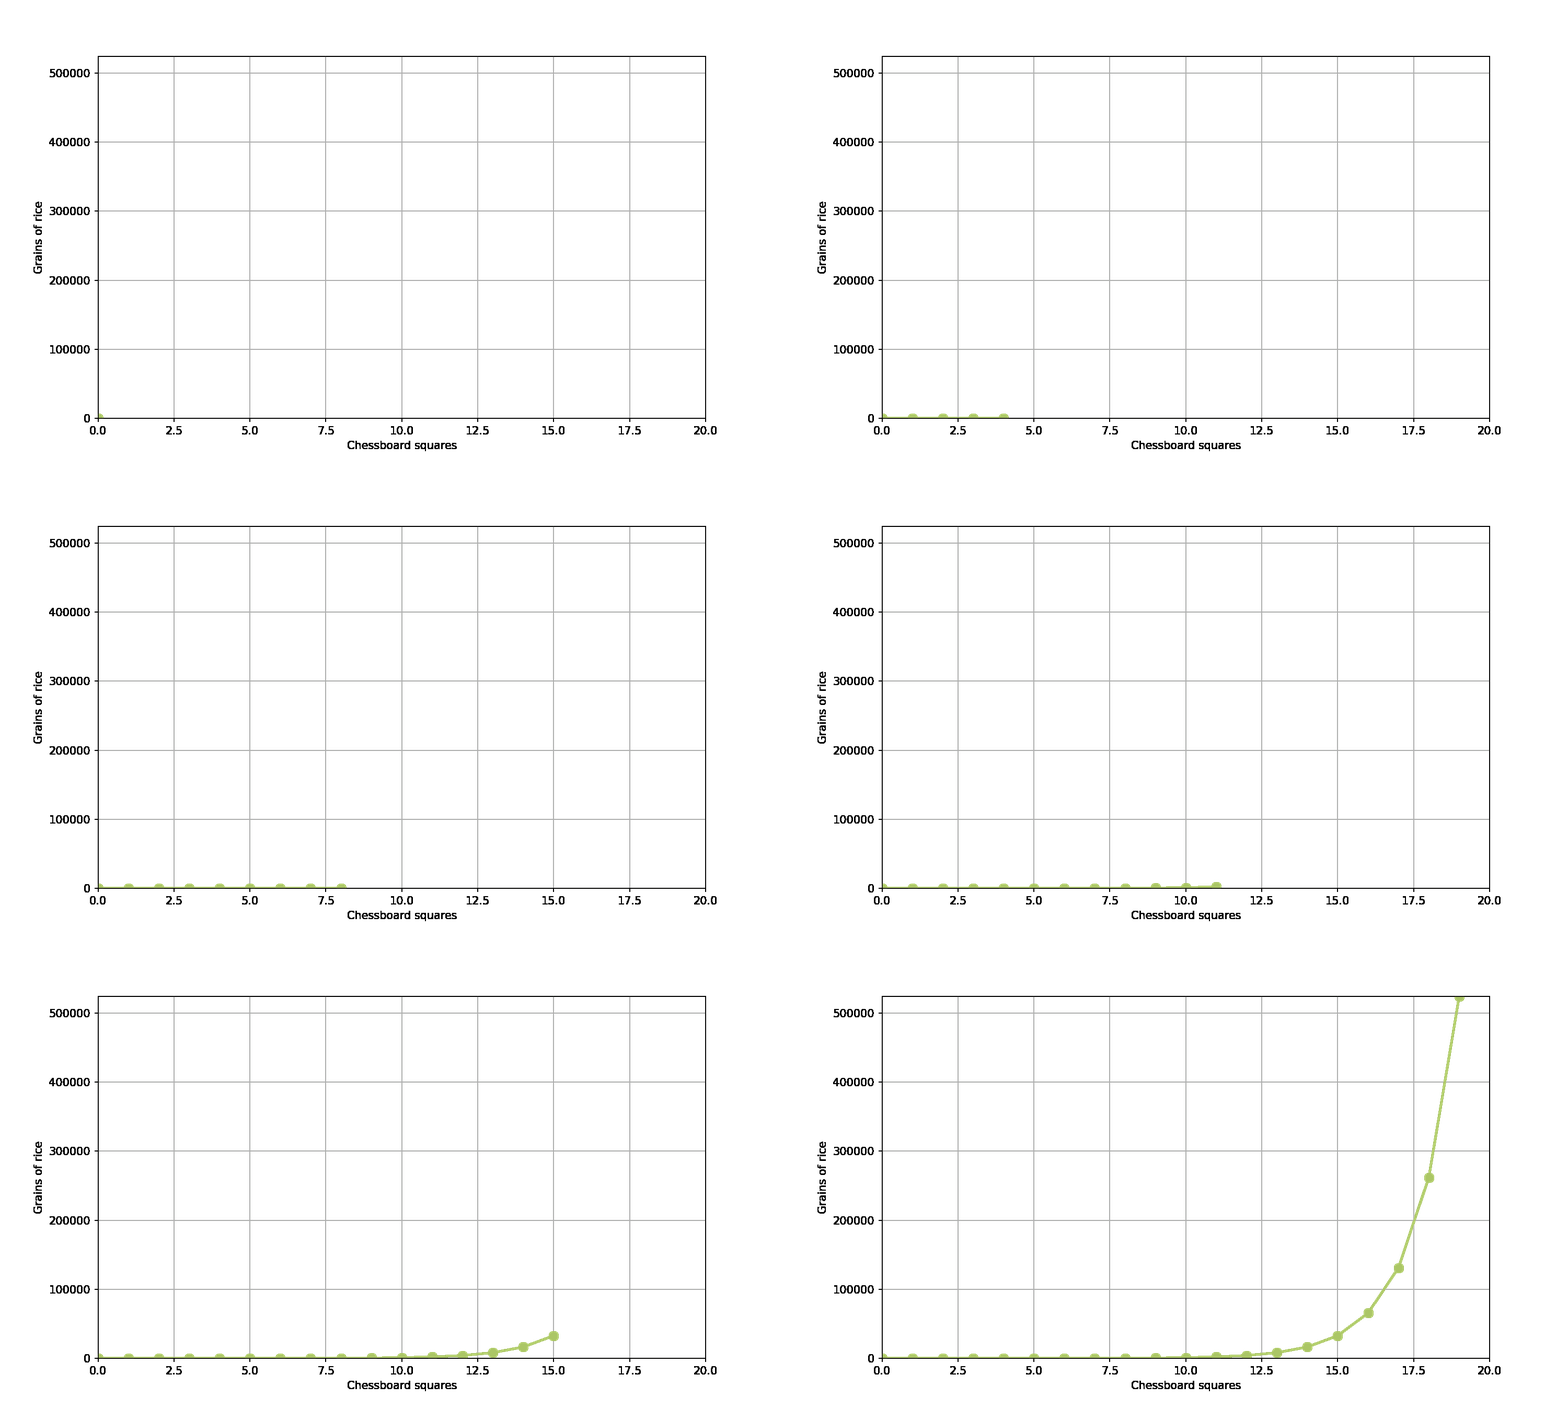
Generally we have
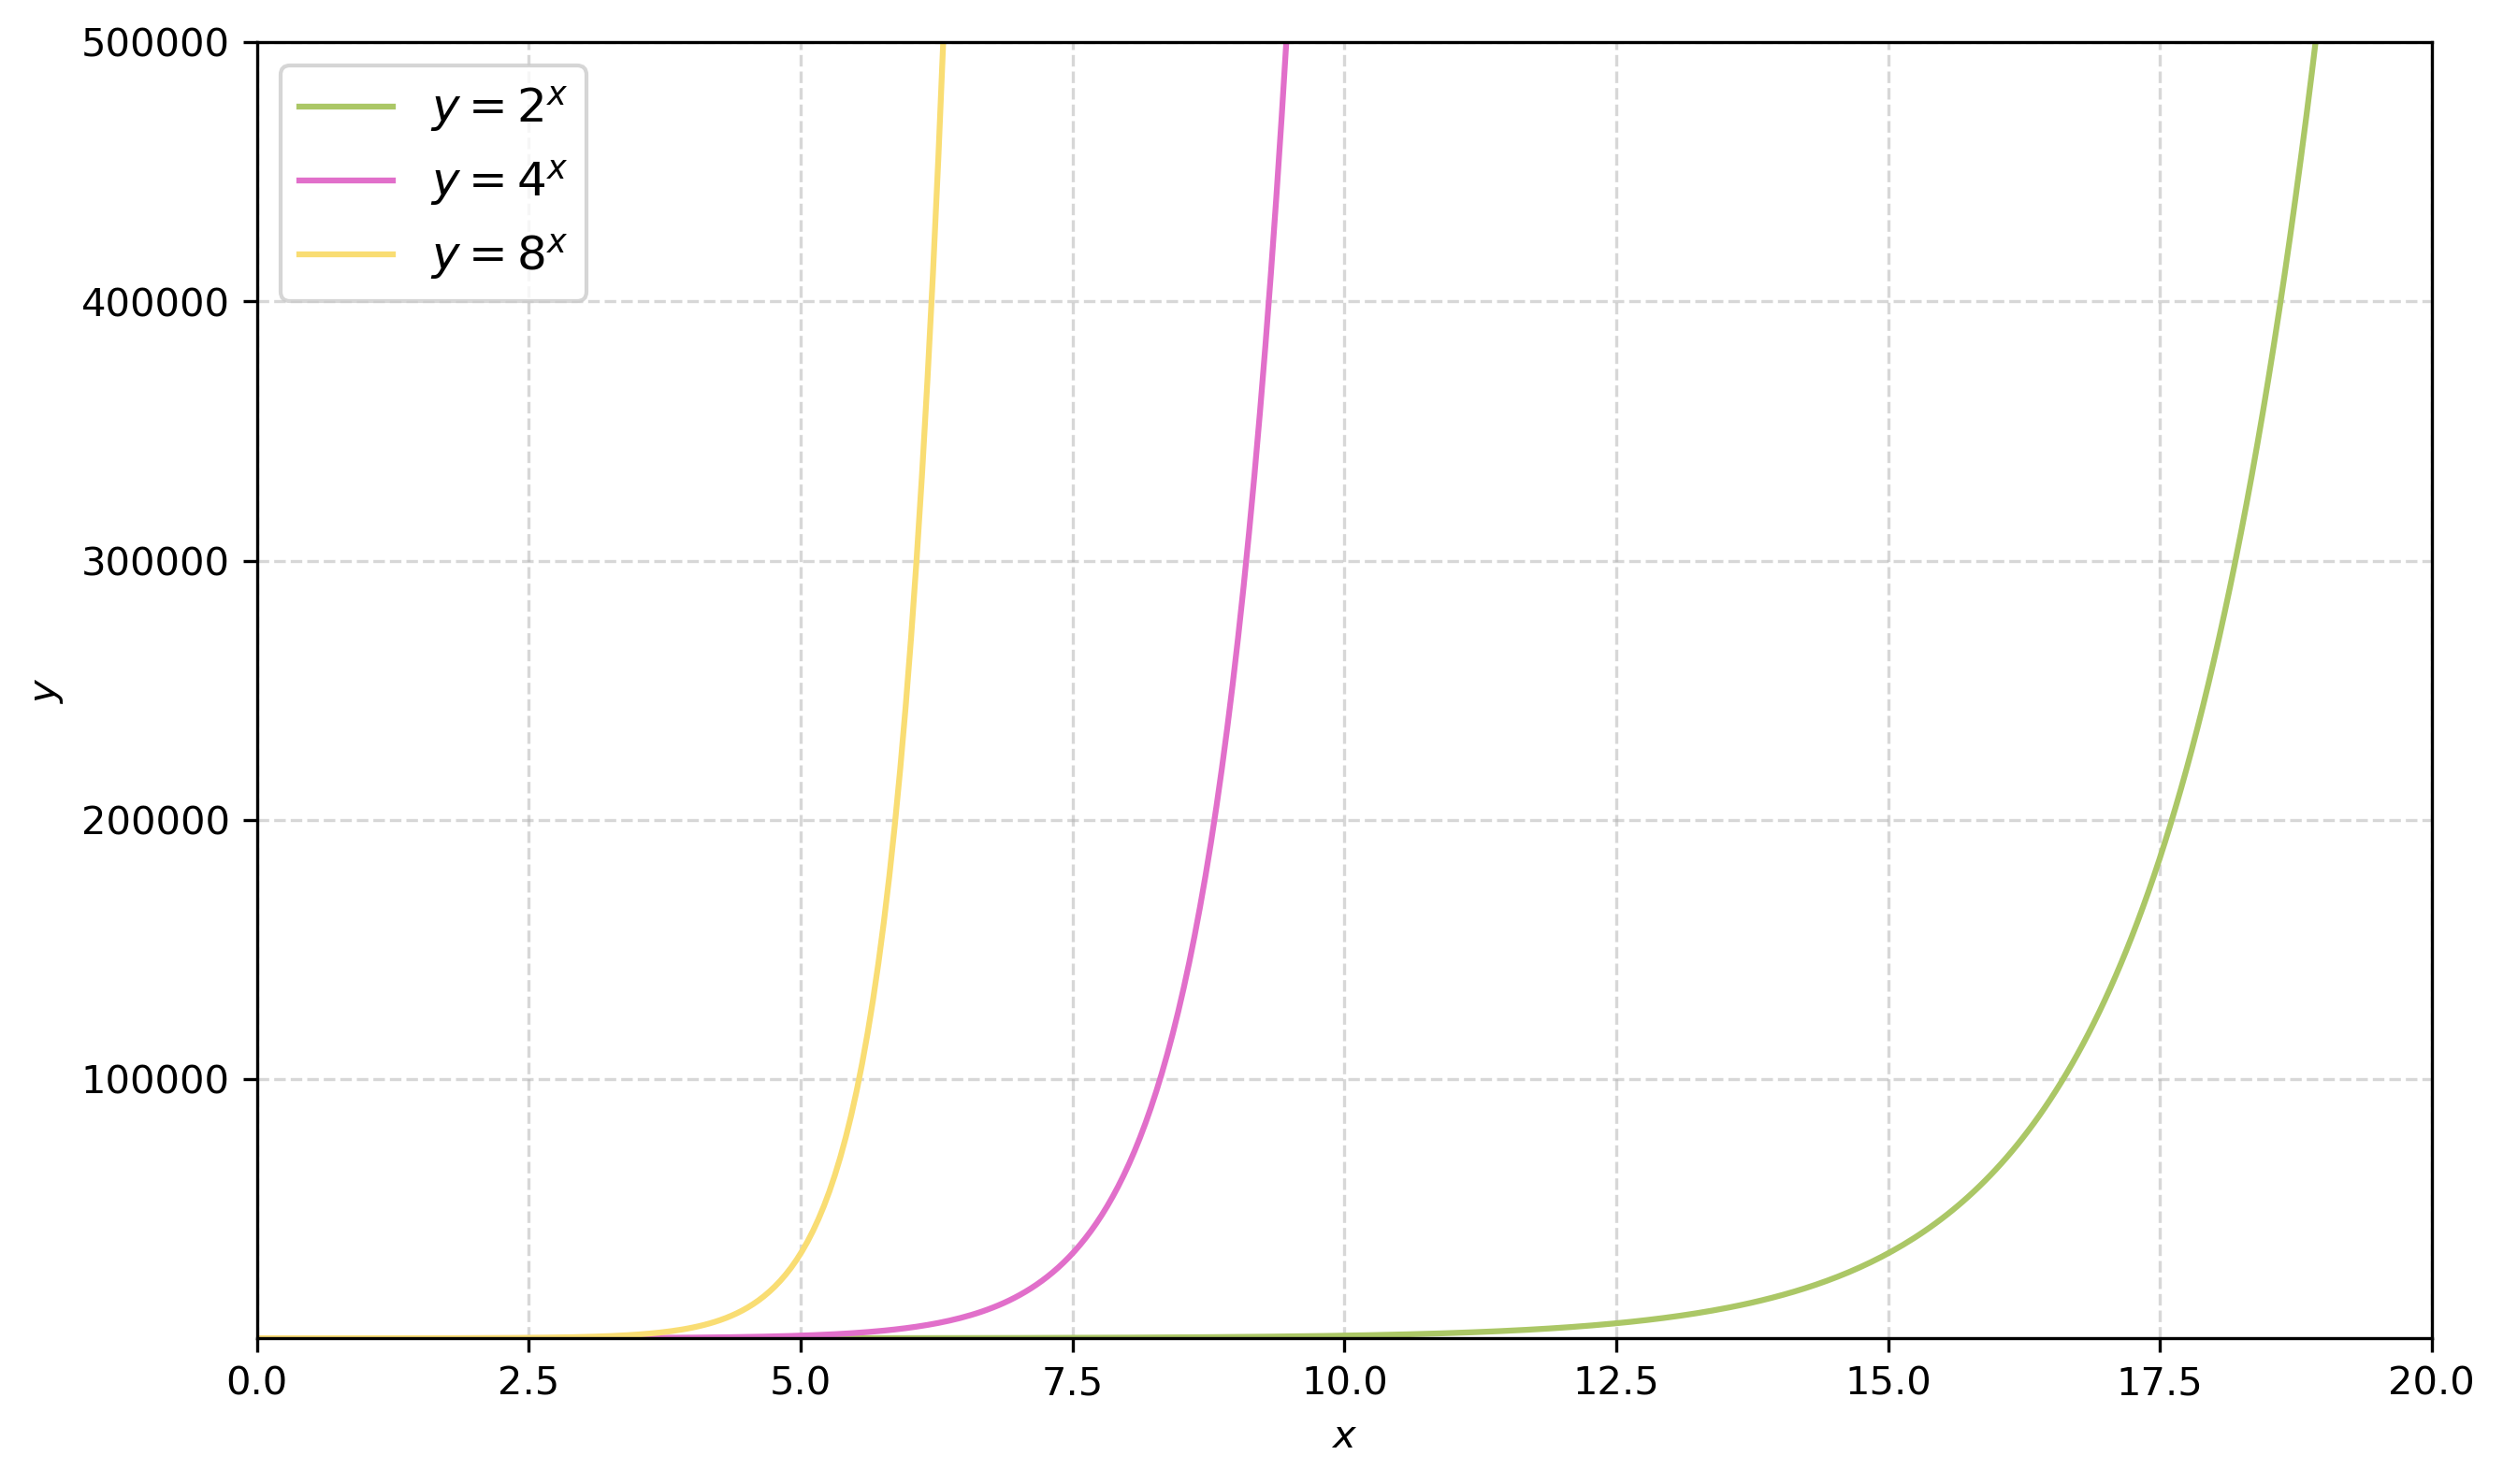
The exponential function
The (natural) exponential function is:
\[\begin{align}
y=e^x
\end{align}\]
\(e \approx 2.718...\) is eulers number - a mathematical constant.
As in the poisson distribution \(\lambda\) is the fixed rates of events for a predetermined time interval.
Note
This is sometimes referred to as the negative exponential distribution - as it is a negative exponent.
Traditionally used to model time between rare events.
time between volcanic eruptions
time between customers entering a shop
time of radioactive decay
Example 1: wait time for a bike-share arrival
One Lime bike arrives at the docking station every minute.
What is the probability that it will be ten minutes until the next bike arrives?
\(\lambda=1\)
\(p(10) = 1 \times e^{-1 \times 10}\)
from scipy.stats import exponlambda_1min =1# rate per minutex =10# time in minutesp_10min = expon.pdf(x, scale=1/lambda_1min)print("Probability of 10 minutes until next bike arrives: {}".format(round(p_10min, 4)))
Probability of 10 minutes until next bike arrives: 0.0
Timmy C found a bike in time.
Example 2: wait time for a bike-share arrival
One Lime bike arrives at the docking station every minute.
What is the time at which the probability of a bike arrival is 0.5?
\(\lambda=1\)
\(0.5 = p(x) = 1 \times e^{-1 \times x}\)
what is \(x\)?
This is easier said than done – the best way is to invert the equation.
Probability distributions
Normal
Binomial
Poisson
Exponential
Type
Continuous
Discrete
Discrete
Continuous
Shape
Symmetric, one peak
Depends on \(p\); symmetric if \(p=0.5\)
Right-skewed (more symmetric as \(\lambda\) grows)
Right-skewed, highest at zero
Parameters
\(\mu\), \(\sigma\)
\(n\), \(p\)
\(\lambda\)
\(\lambda\)
Probability function
PDF
PMF
PMF
PDF
Quiz
The cross at Charing Cross - the geographic centre of London.
What probability distribution most likely describes the following data?
Heights of a sample of UCL students
The number of students arriving at the lecture in the next ten minutes
Commute distance to work in London
Public votes for a new block of flats in the borough of Camden
How far north or south people’s guesses of Charing Cross are from the actual location (signed: + north, − south)
\[\begin{align}
a^x = b \implies \log_a(b) =x
\end{align}\]
For the natural logarithm:
\[\begin{align}
e^x = b \implies \log_e(b) =ln(b) = x
\end{align}\]
Why transform?
Because logarithms undo exponentials, they give us two very useful tools for data:
Straighten exponential growth
Tame long right tails
The most important rules:
\[\begin{align}
log_a(a^x) = x
\\ ln(e^x) = x
\end{align}\]
Log it! to straighten growth
As the logarithm inverses the exponential, taking the logarithm of an exponential function will result in a linear relationship.
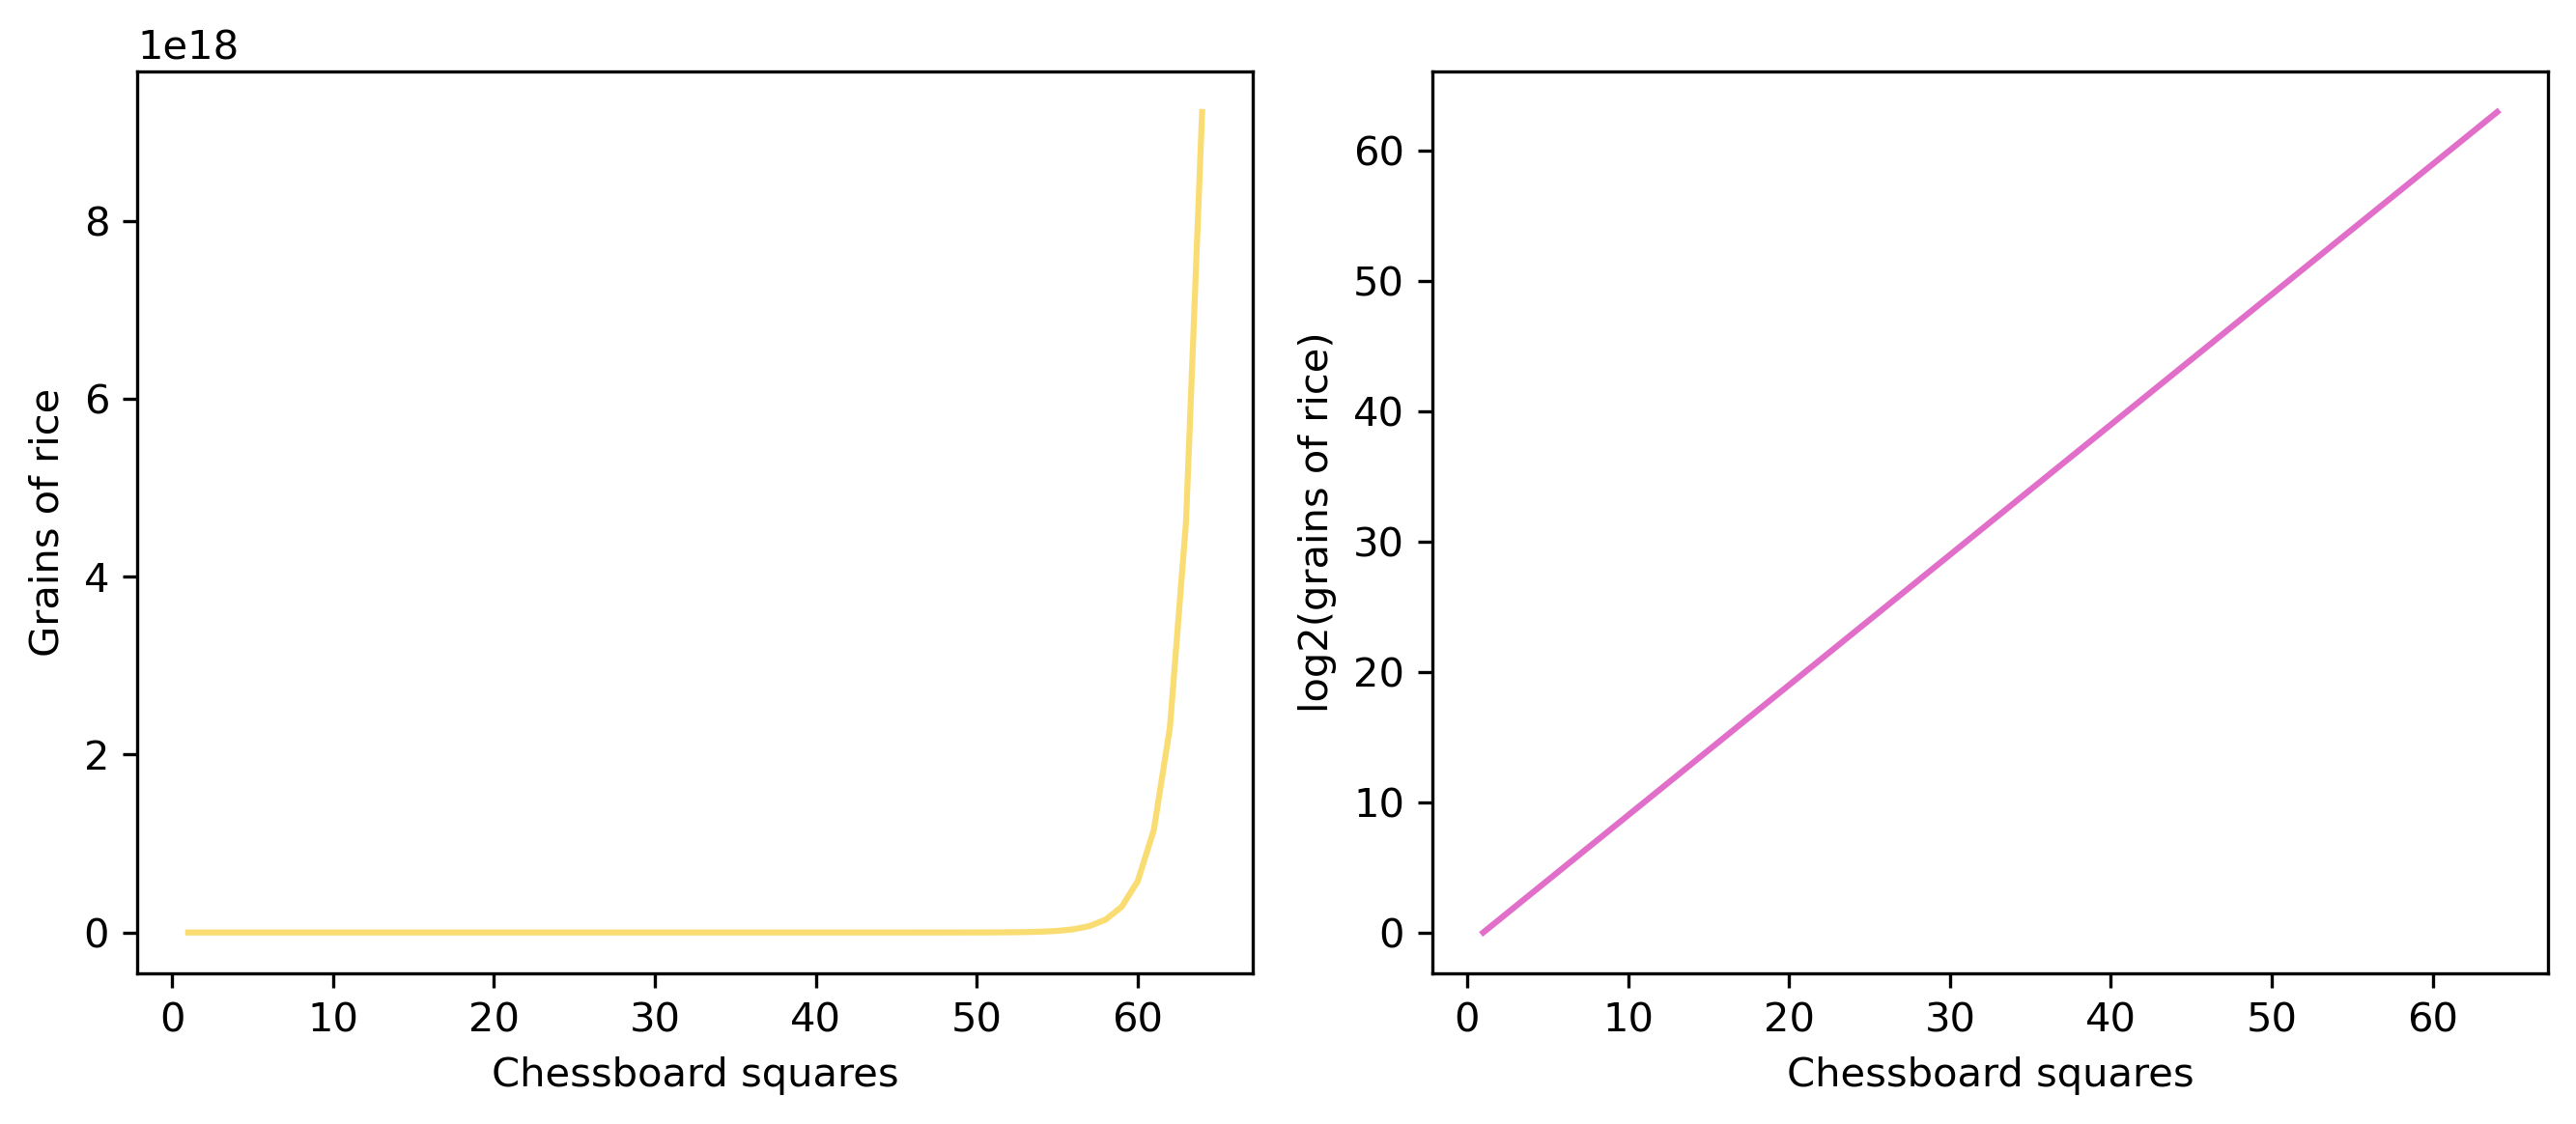
Here we take log base 2, which results in a line through \(y=x\), but any base will work.
Log it! to tame long tails
Long right tail, no typical size: most schools cluster at low absence, but a few sit far out — after the log it looks much closer to normal.
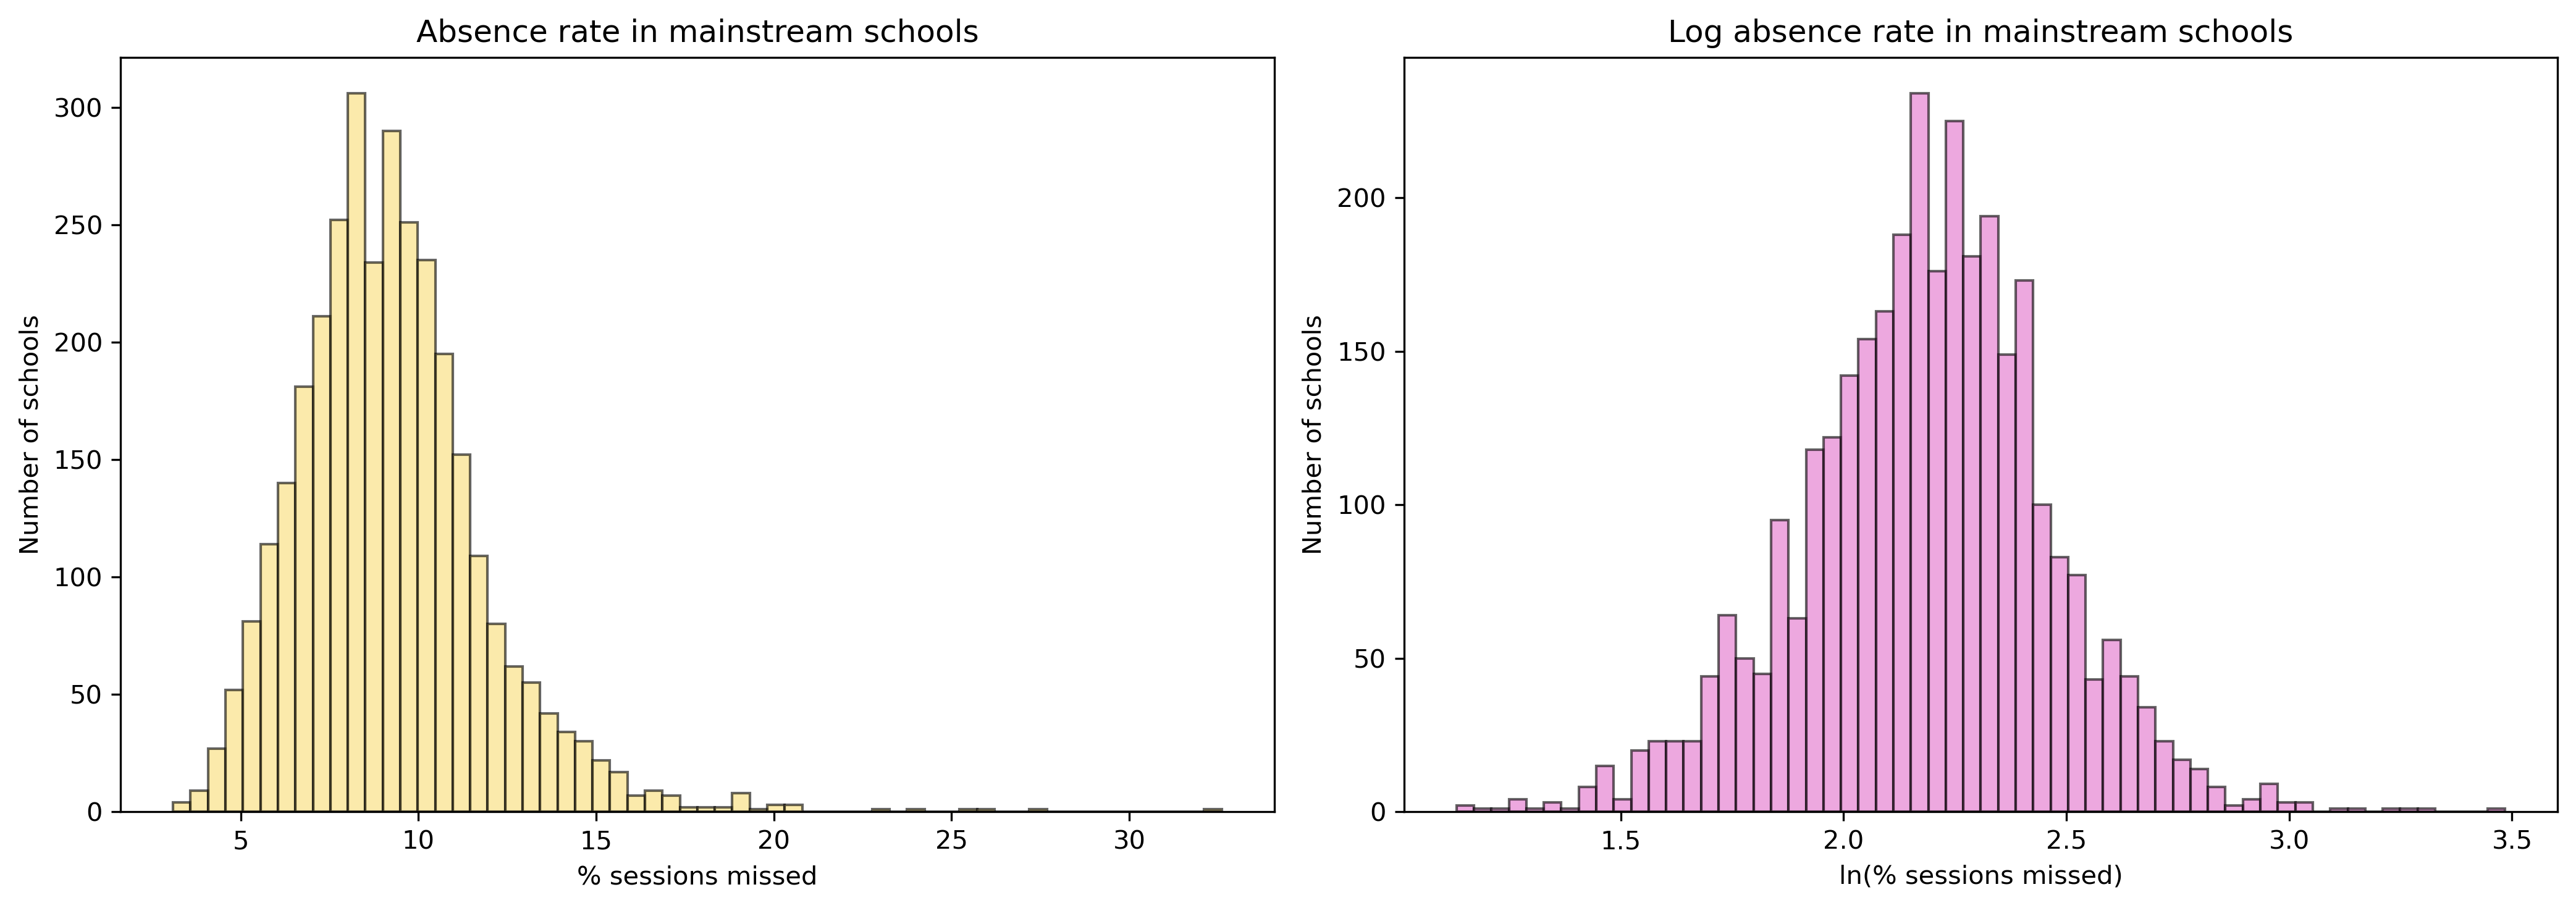
Here we take log base \(e\) (the natural logarithm). This is the most common choice in statistics and data analysis, but any base will work.
Representative data
Before we try to describe the data, it’s important to know where the data came from.
The dream vs reality
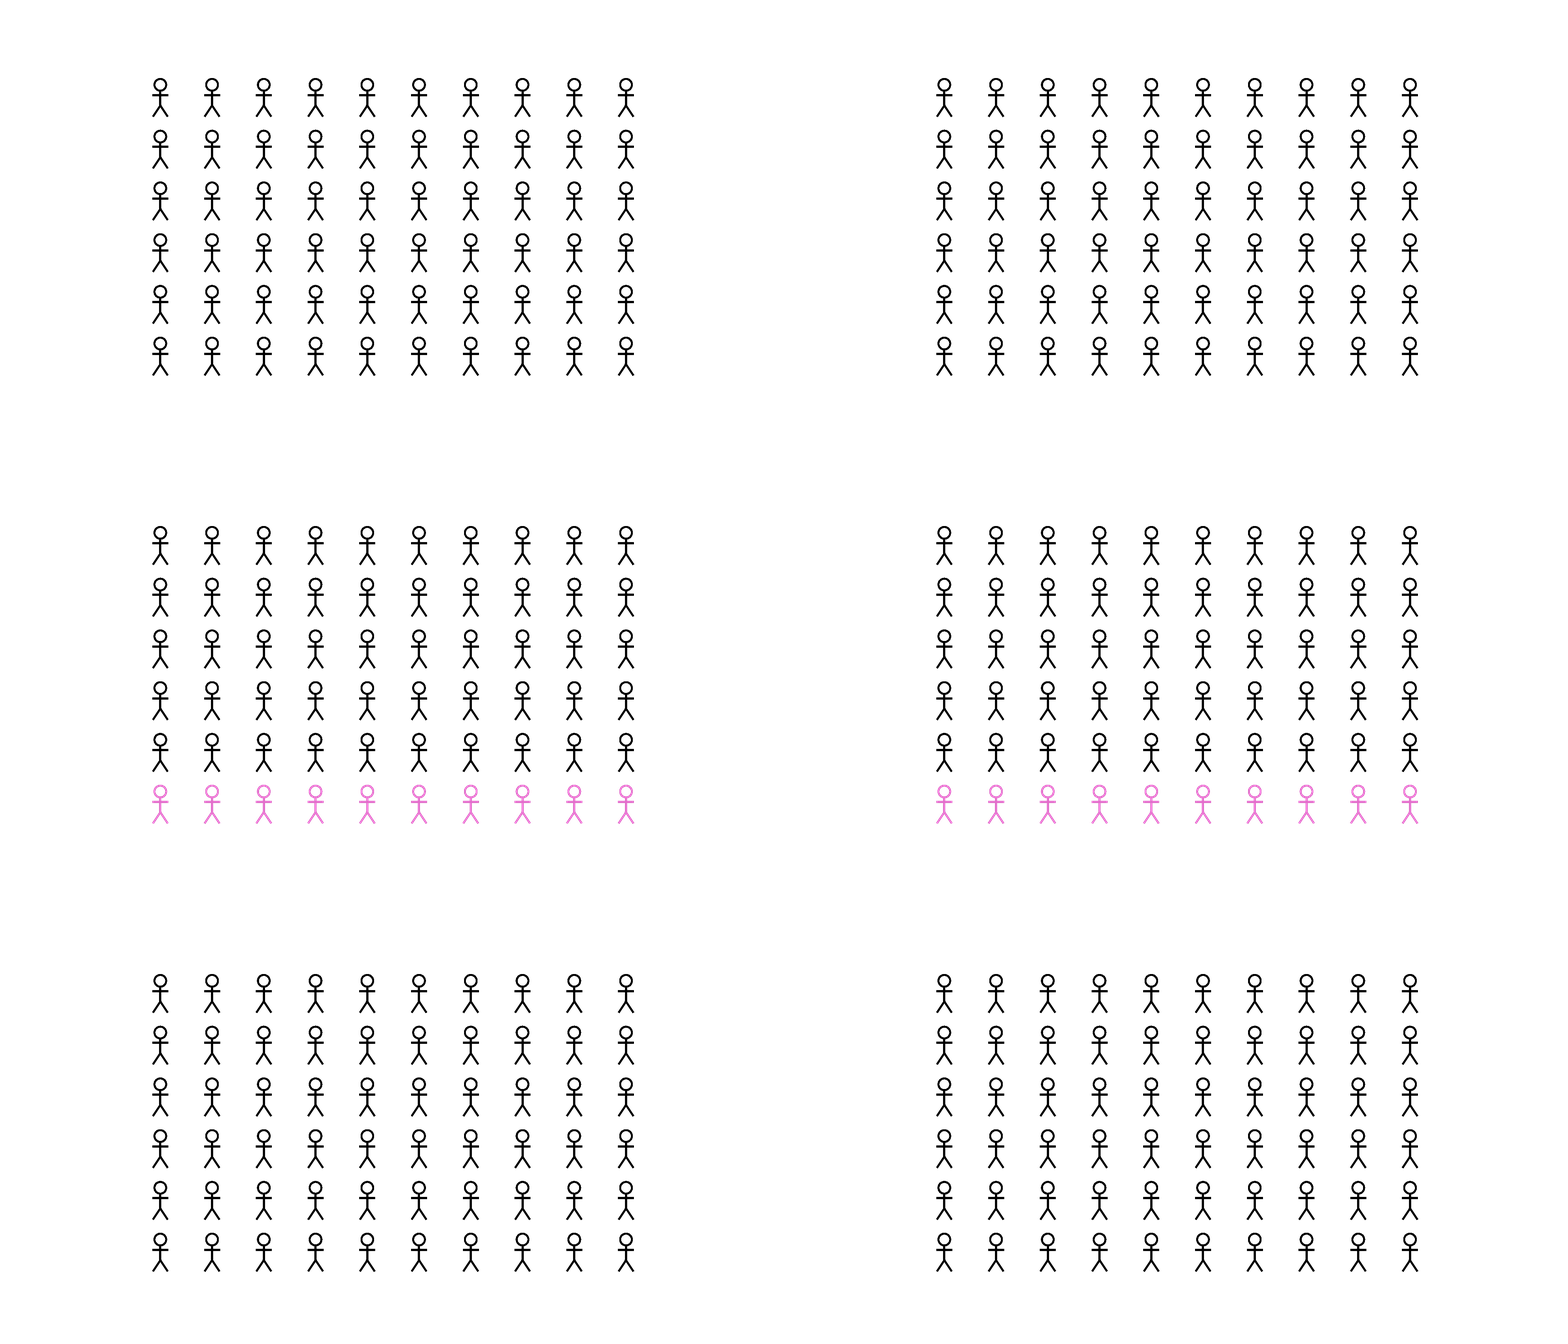
Ideally, we would like all the relevant data.
… in reality we normally only have some.
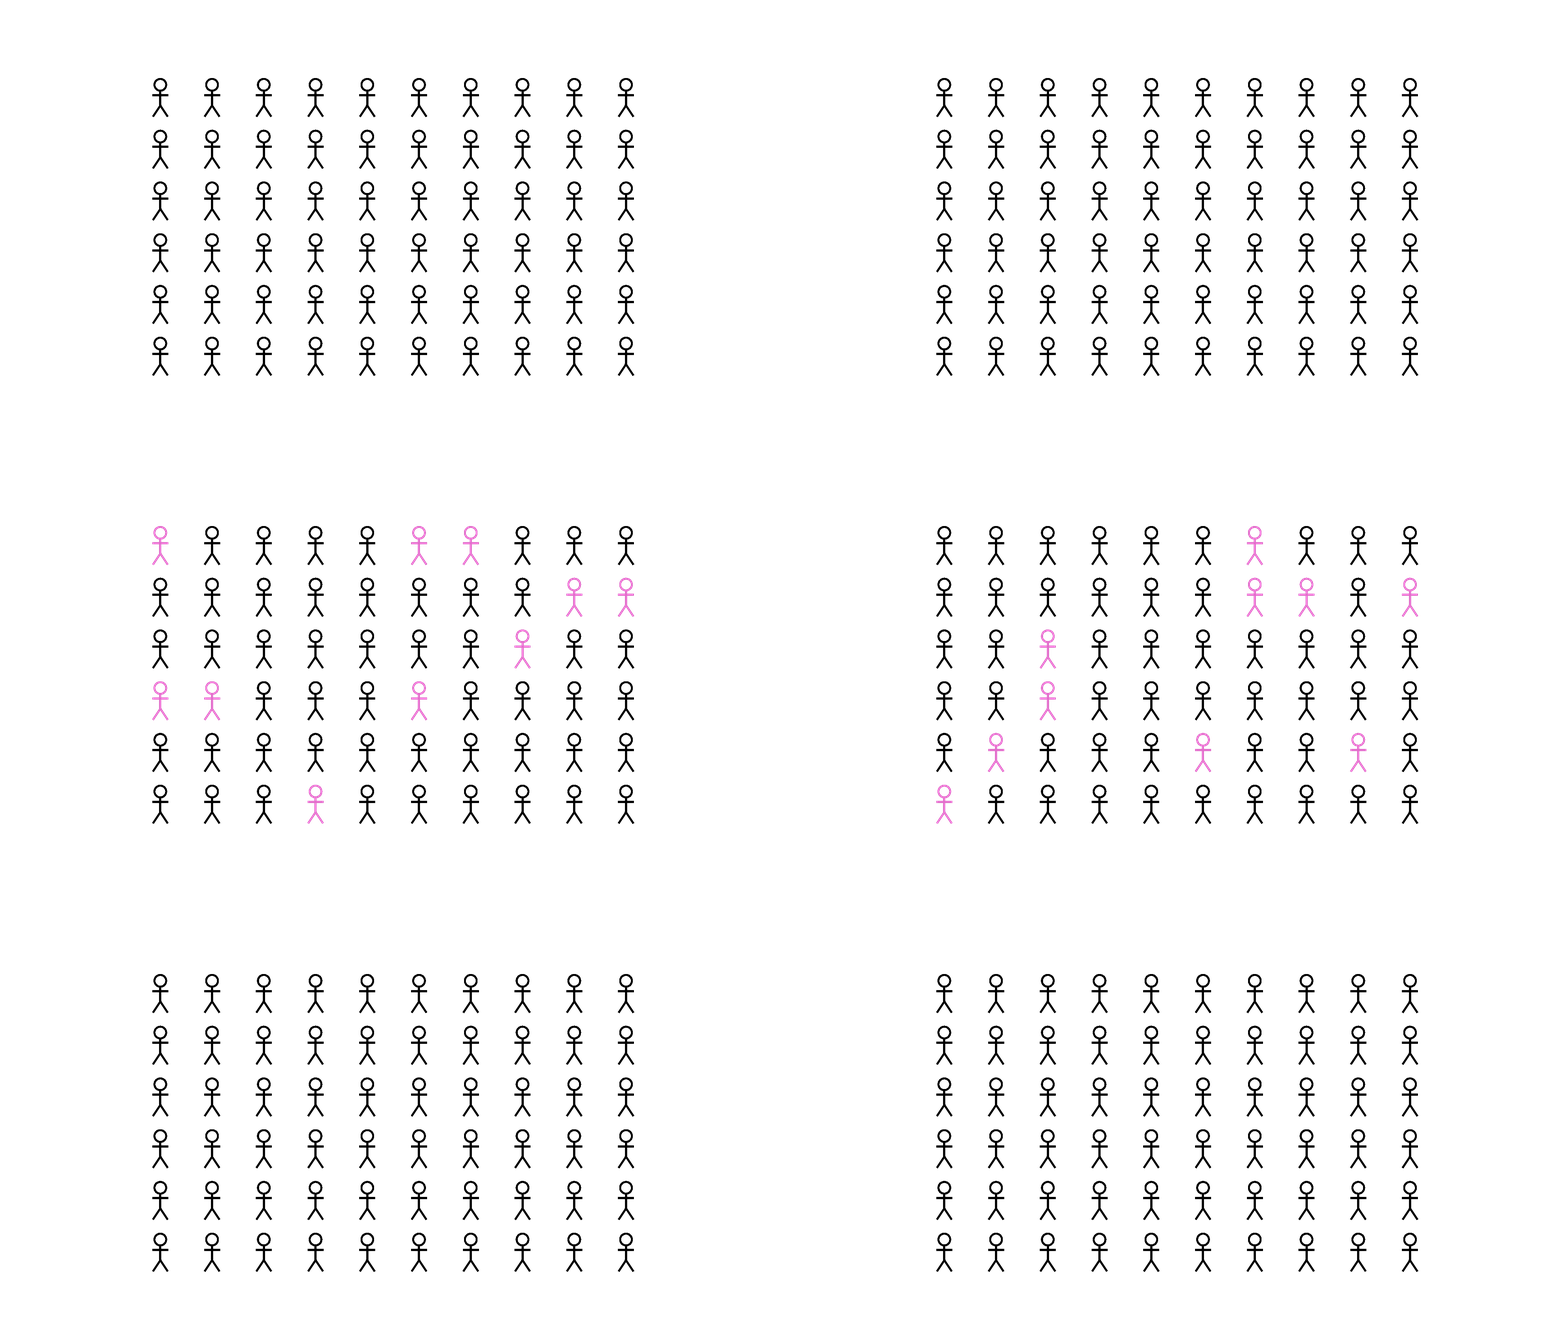
Approximating
Hence, we sample a subset of the data. We need to choose our sample carefully - we want what happens in the sample to approximate what happens in the whole population.
In practise we might try different sampling approaches such as:
random sampling
systematic sampling
Bias
It’s important to understand if your dataset is unrepresentative or biased.
Where does bias creep in?
Three places, three questions:
In the sample: selection bias. Who ended up in the data, and who didn’t?
In the world: historical bias. What existing inequalities does the data reflect?
In the analyst: cognitive bias. What did we choose to collect, keep and report?
Particularly important for large datasets and AI models, where the model can learn patterns that aren’t obvious to us.
Selection bias
When the sample chosen doesn’t represent the whole population of interest