| Count | |
|---|---|
| Schools with a KS4 result | 4,631 |
| Of which state-run | 3,250 |
| Variables in the full release | 700+ |
| Local authorities covered | 153 |
Exploratory Data Analysis #1
Part 1 - describing what you have
- a.dennett@ucl.ac.uk
18 September 2026
CASA0007 Quantitative Methods
Survey before you build
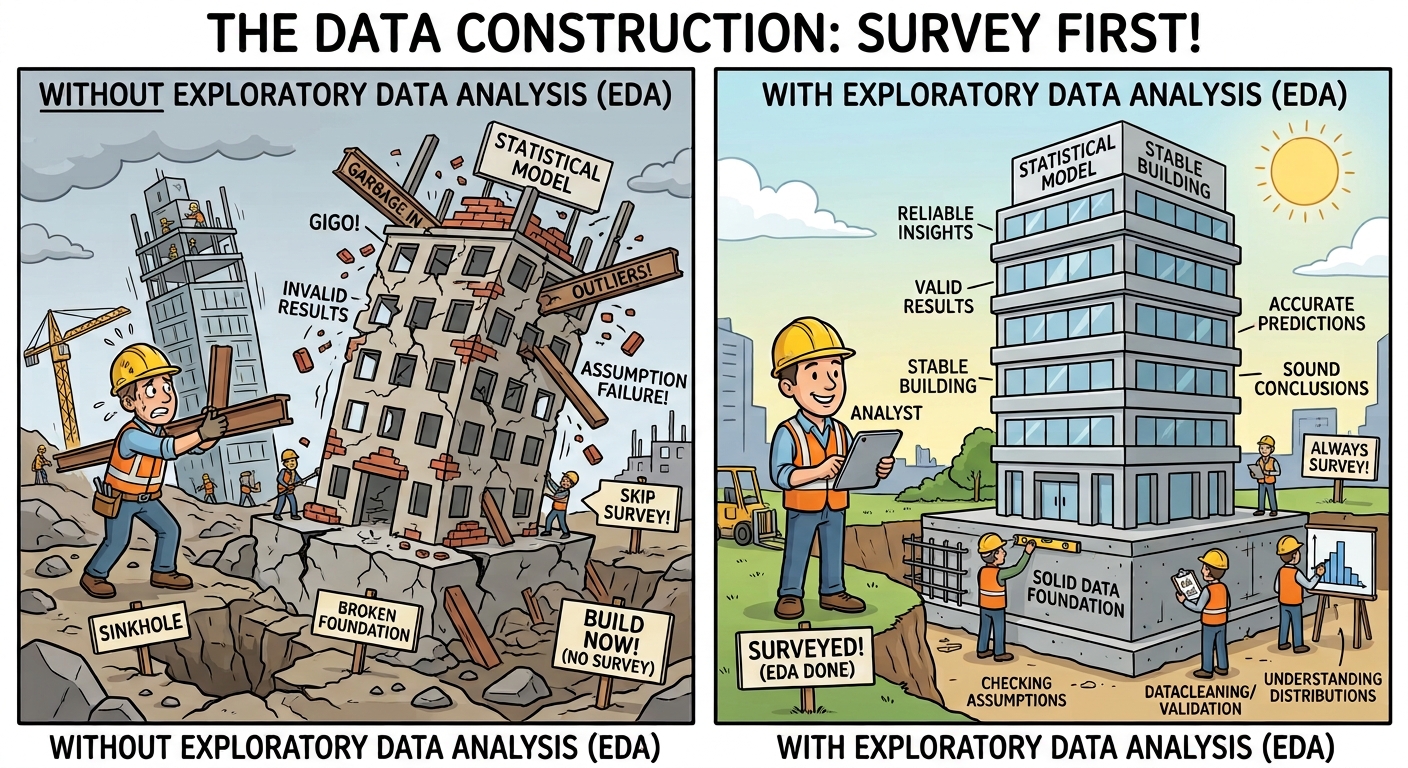
Nobody pours concrete without surveying the ground first. The same logic applies to everything we do this term — the model is only ever as sound as what it is built on.
Nominal
- Differentiates items based only on names; no order between them
- Also called categorical data
- What can be said about them?
- ✅Equality: an Academy is not a Special school
- ✅Mode: the most common category
In our data: school type, religious character, region, admissions policy.
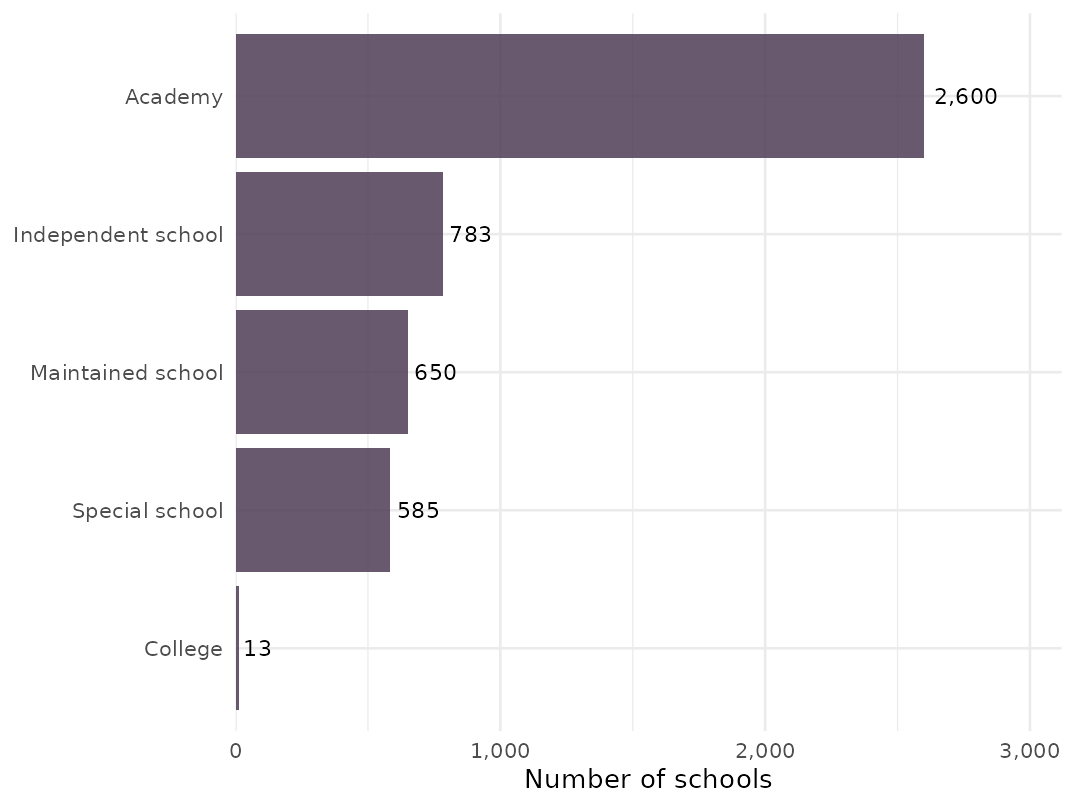
The bars can be reordered freely — there is no natural order here
Ordinal
- Allow for rank order, but not the relative degree of difference
- What can be said about them?
- ✅ Equality; mode
- ✅ Median: middle-ranked item
- ❌ Differences between two levels; arithmetic mean
- Ordinal can be sub-divided into weak (Amazon star ratings on a product) and strong (1st, 2nd, 3rd finisher in a race)
In our data: Ofsted rating.
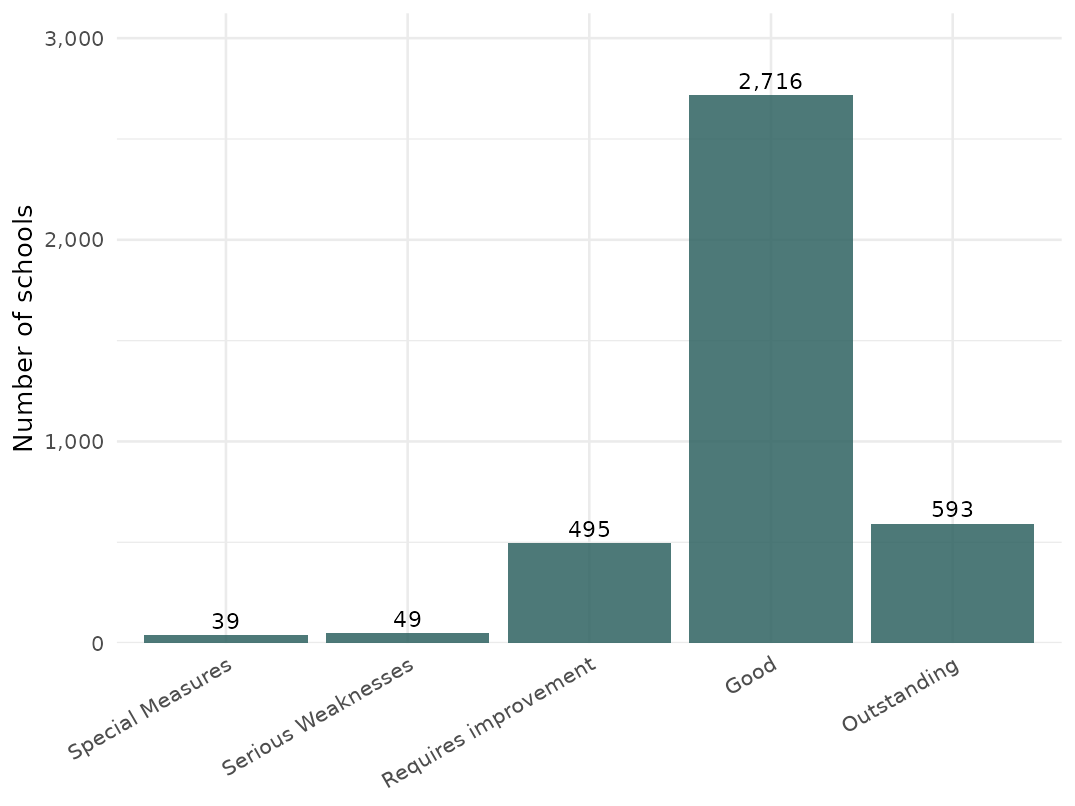
The order cannot be shuffled — but is Good → Outstanding the same size a step as Requires improvement → Good?
Confusing Ratios: Progress 8
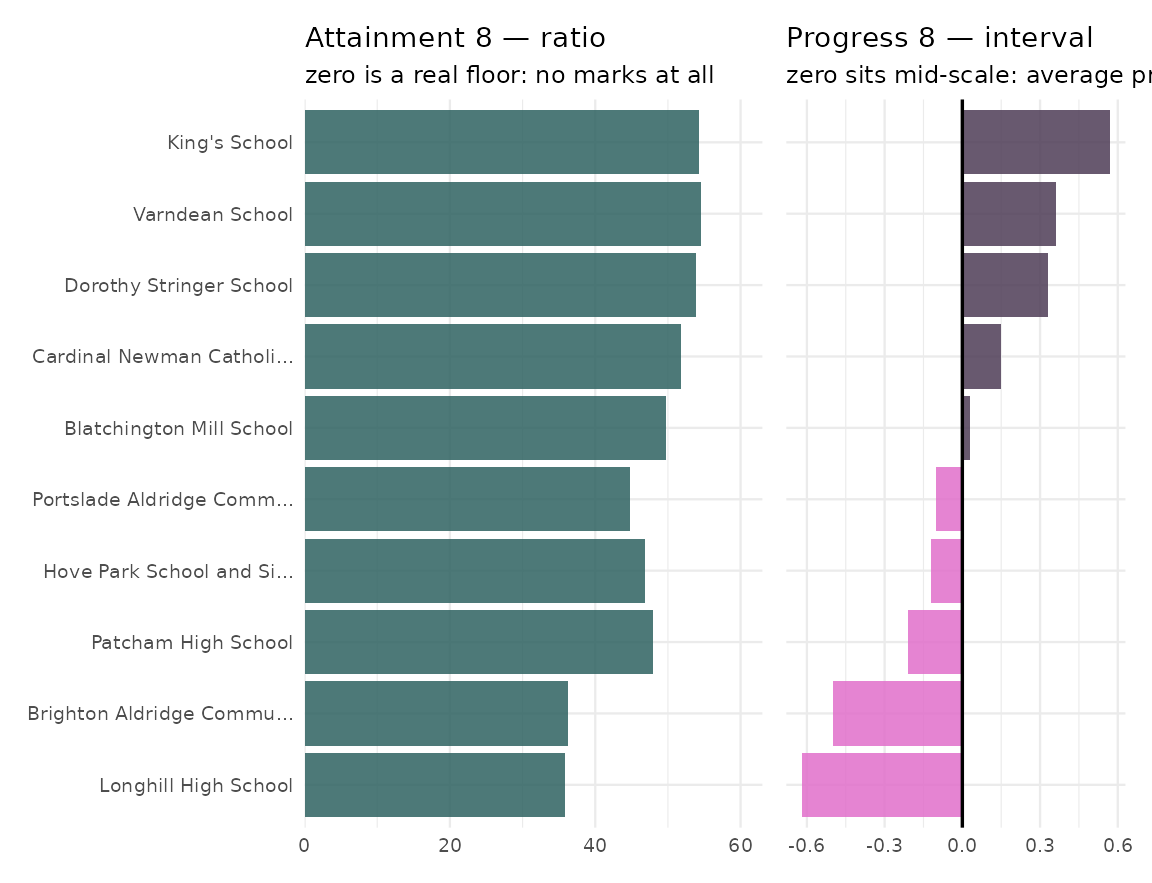
Progress 8 compares the progress pupils made with similar pupils nationally, each year.
- Zero means “average expected progress” - sits in the middle
- Positive is more, negative is less The zero is meaningful. So is it ratio data? No.
- King’s scores 0.57 and Blatchington Mill 0.03 — a ratio of 19:1.
- Not 19 times the progress!
- And Longhill is negative, so no ratio is possible at all.
Descriptive statistics - Visualisation
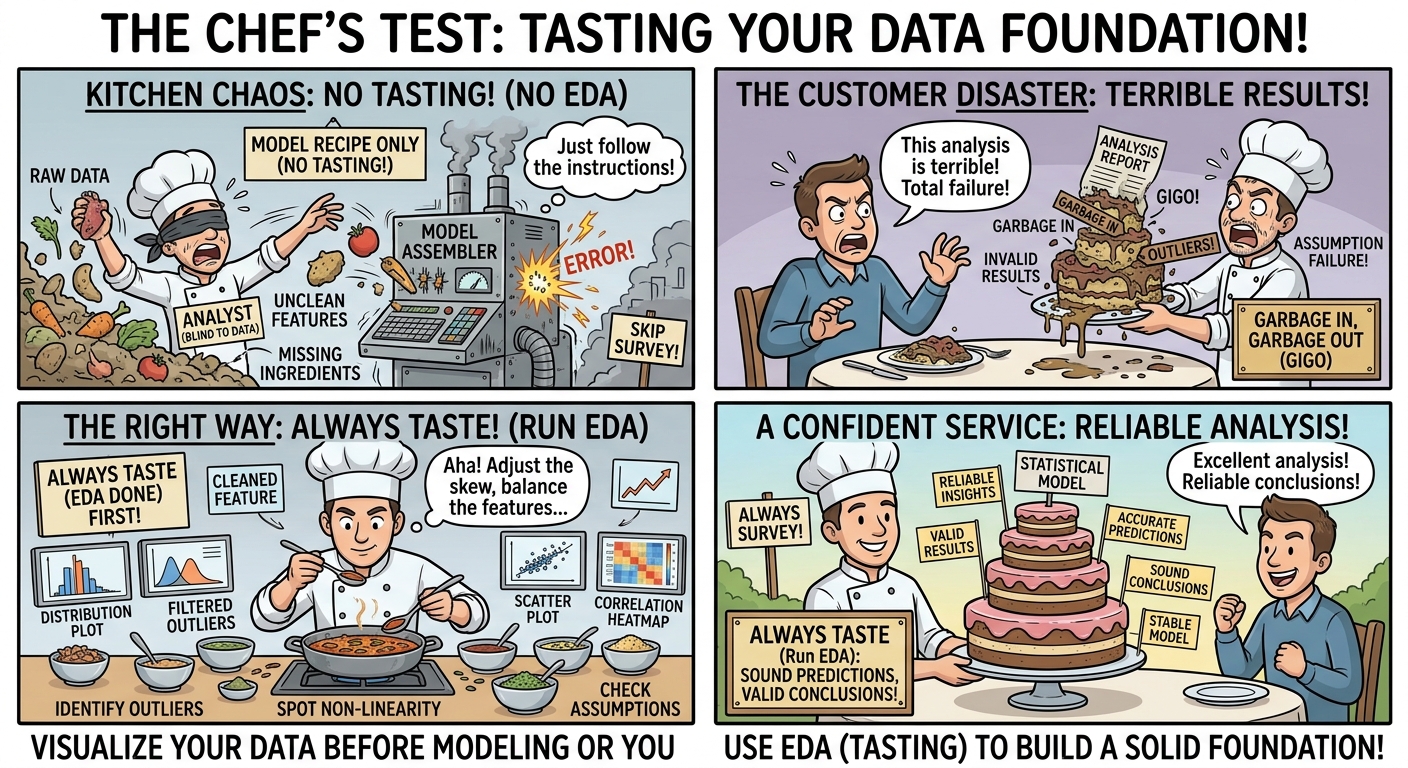
Visualising Your Data - Frequency Distributions
A frequency distribution lets you see the full shape of your data - and all of it’s quirks.
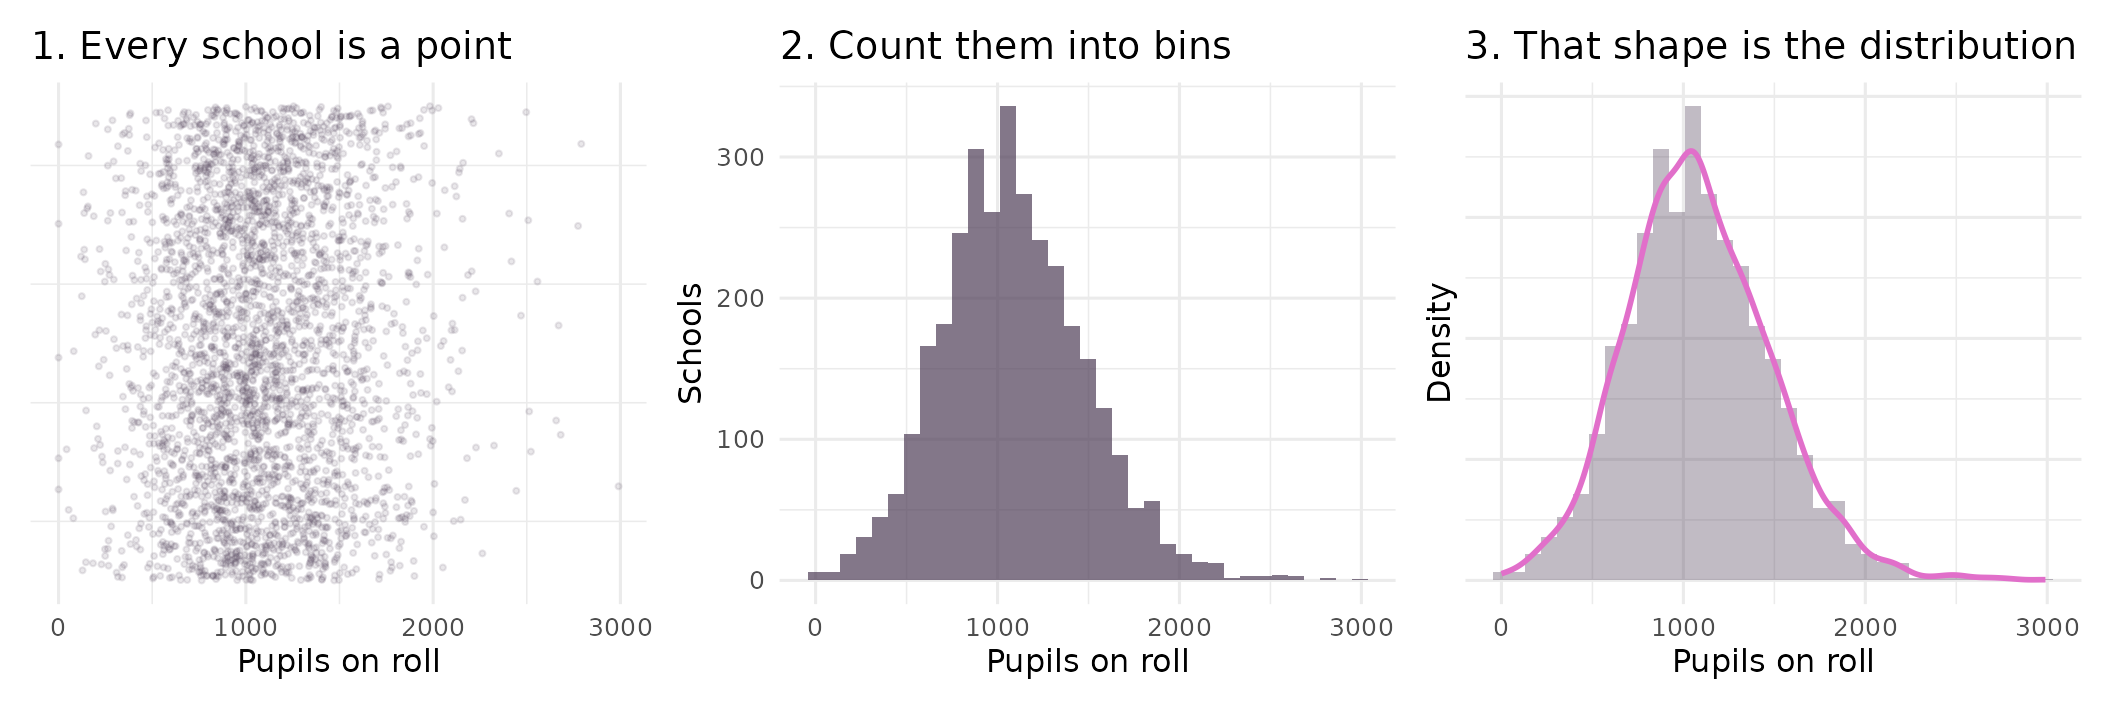
- The histogram is the workhorse: bin the values (any size bin you like), count how many land in each bin
- The smooth curve is the same information with the bins taken away - More Next week
- Almost everything else in this course starts by asking what shape (Frequency Distribution) a variable has
A boxplot is a summarised histogram
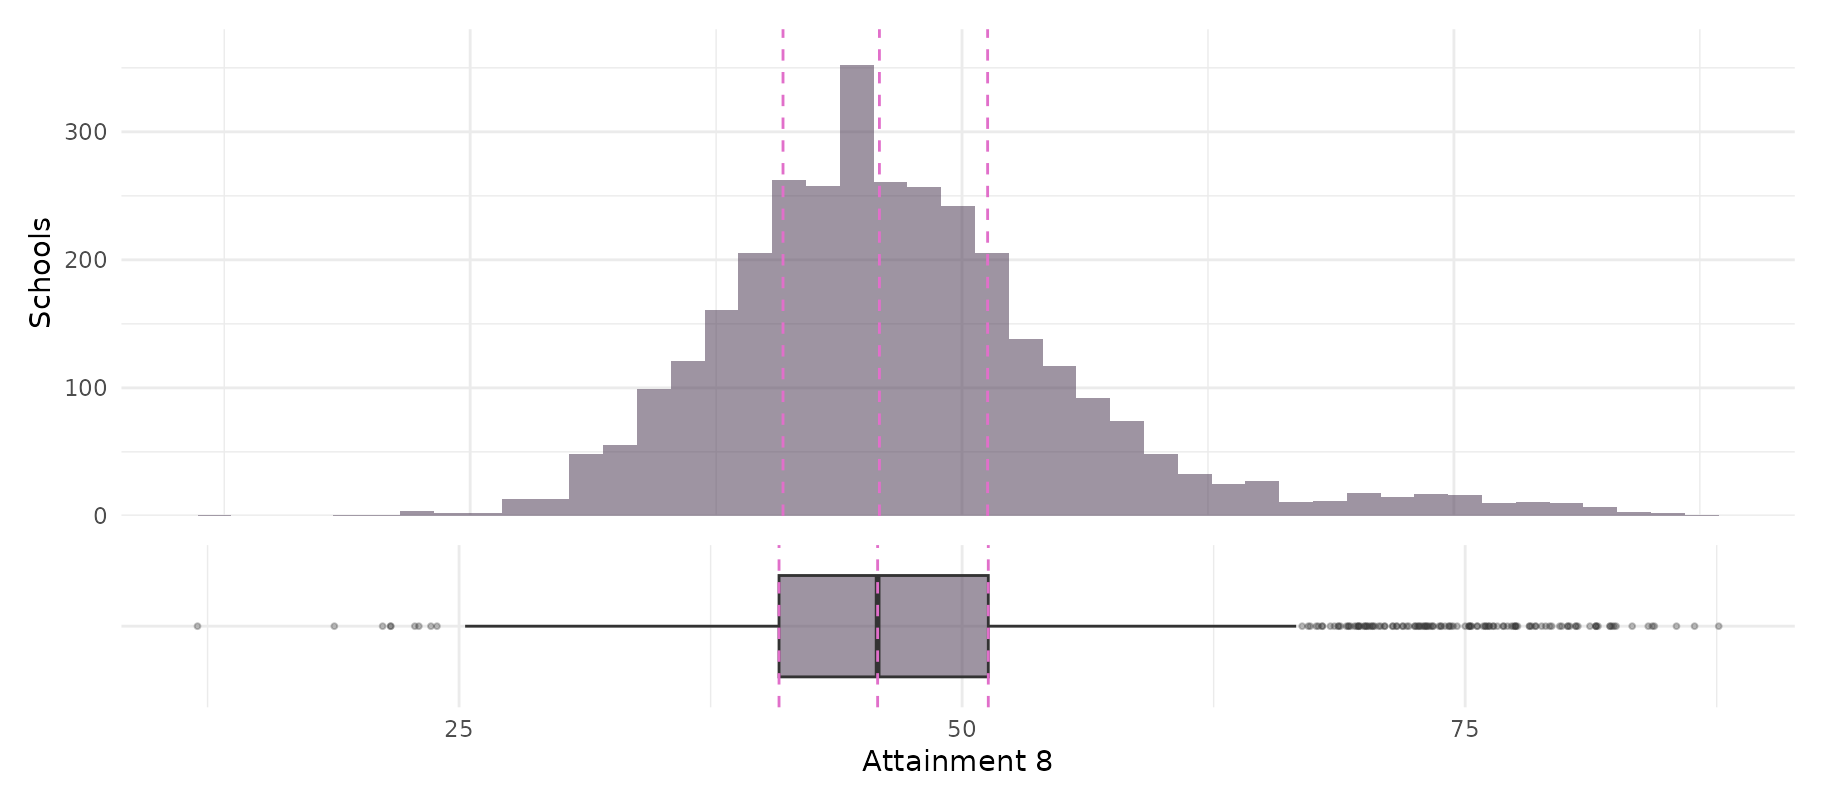
- A boxplot or a box and whisker plot - same data, same axis. The dashed lines are the quartiles
- The box holds the middle 50% of schools (the inter-quartile range or IQR); the line inside it is the median
- The whiskers reach the furthest point within 1.5 × the box width; anything beyond it (the dots) are known as outliers - more later
- A boxplot is a histogram with the shape thrown away and five numbers kept
Four ways to draw the same distribution
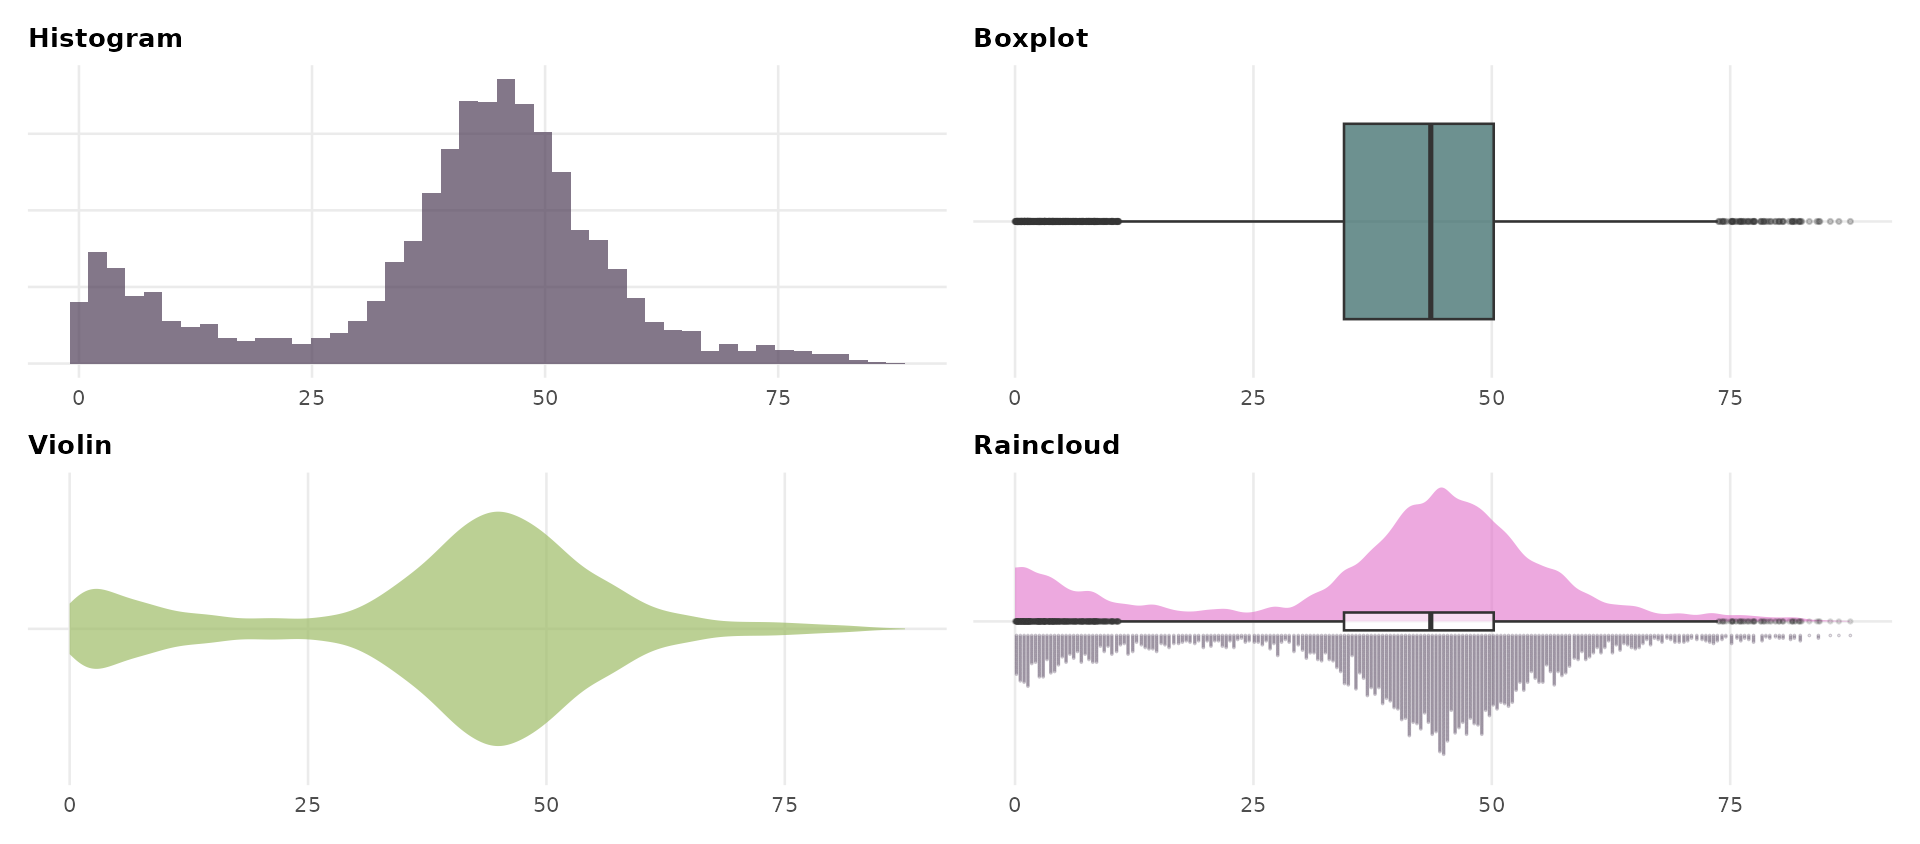
The same 4,631 schools and the same Attainment 8 scores, four times over. Three of these show you that the data has more than one hump. One of them does not.
Count Data
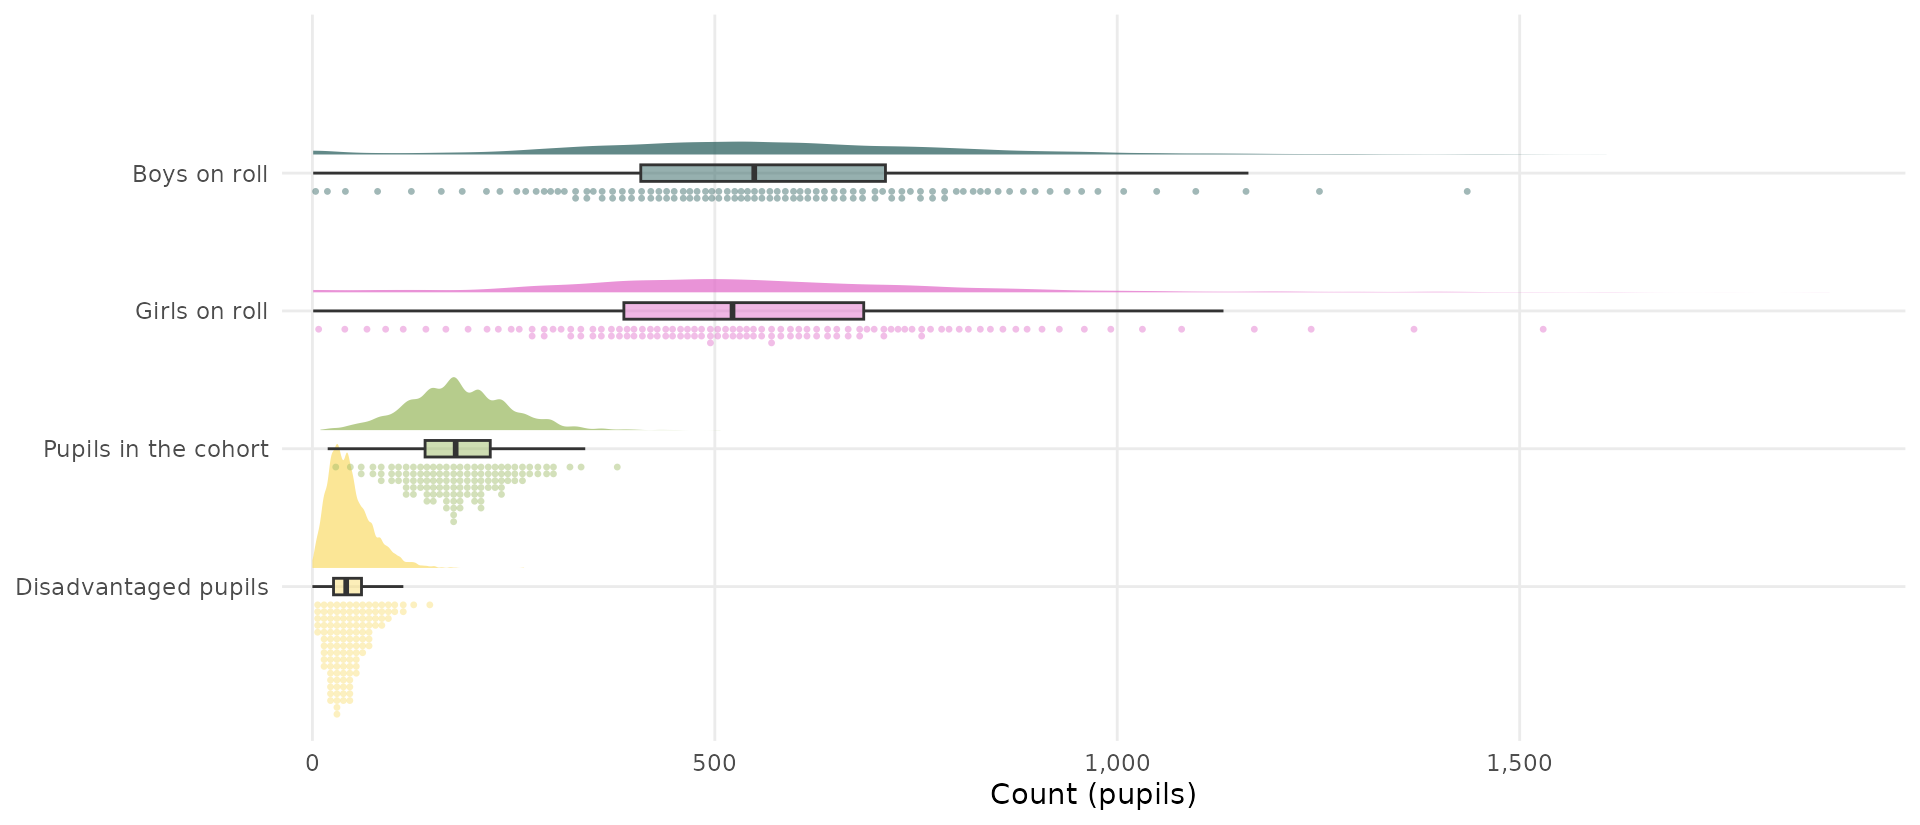
Five counts, one axis. Each cloud is the distribution, the box the quartiles, the rain below it the schools themselves.
Binomial Data
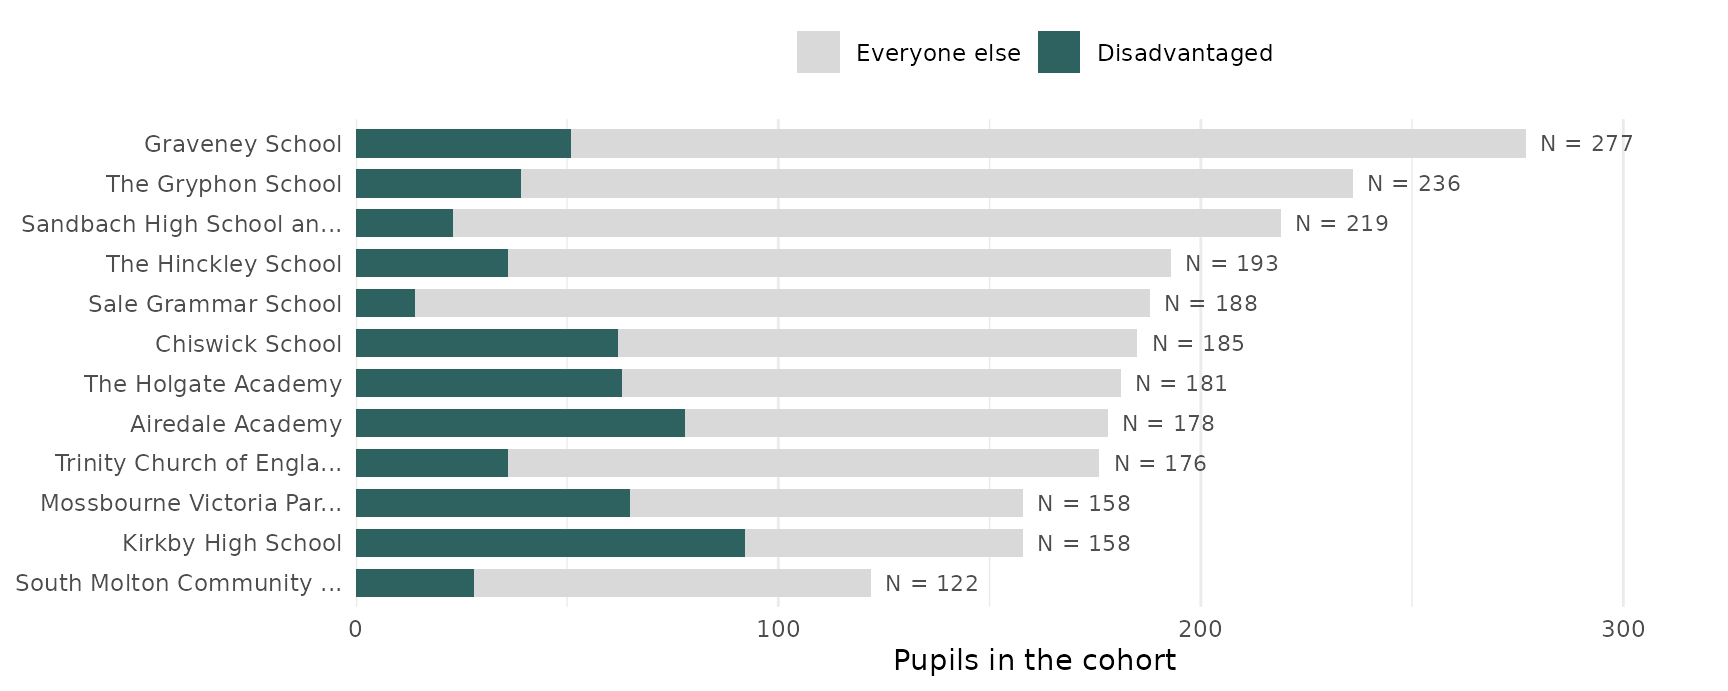
- A count bounded above by the size of the cohort — it cannot exceed an upper ceiling N — e.g. a finite number of coin tosses, or children in a school
- Each bar is a school’s ceiling. The teal part is the count; it can never spill past the end of its own bar
- Every school has a different ceiling, which is why the raw count tells you so little
- Distribution: binomial. This is why a percentage is the natural summary.
Real-valued additive
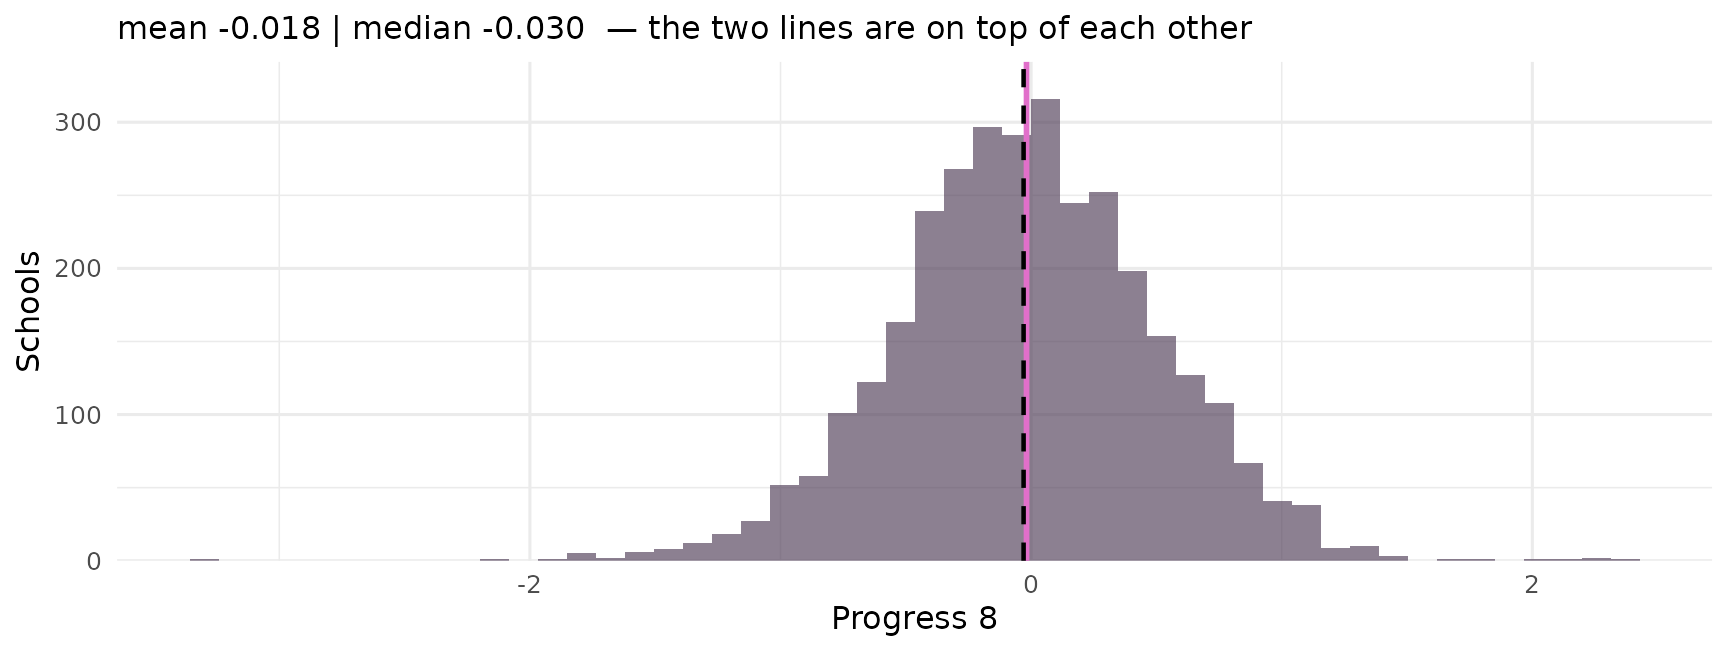
- A real number can be placed anywhere on a line - i.e. can have a decimal
- Can be negative. Symmetric about its mean.
- Mean -0.018 (pink like), median -0.030 (black dotted) — almost identical
- Distribution: normal. Model: ordinary linear regression — weeks 6 and 7.
Real-valued multiplicative
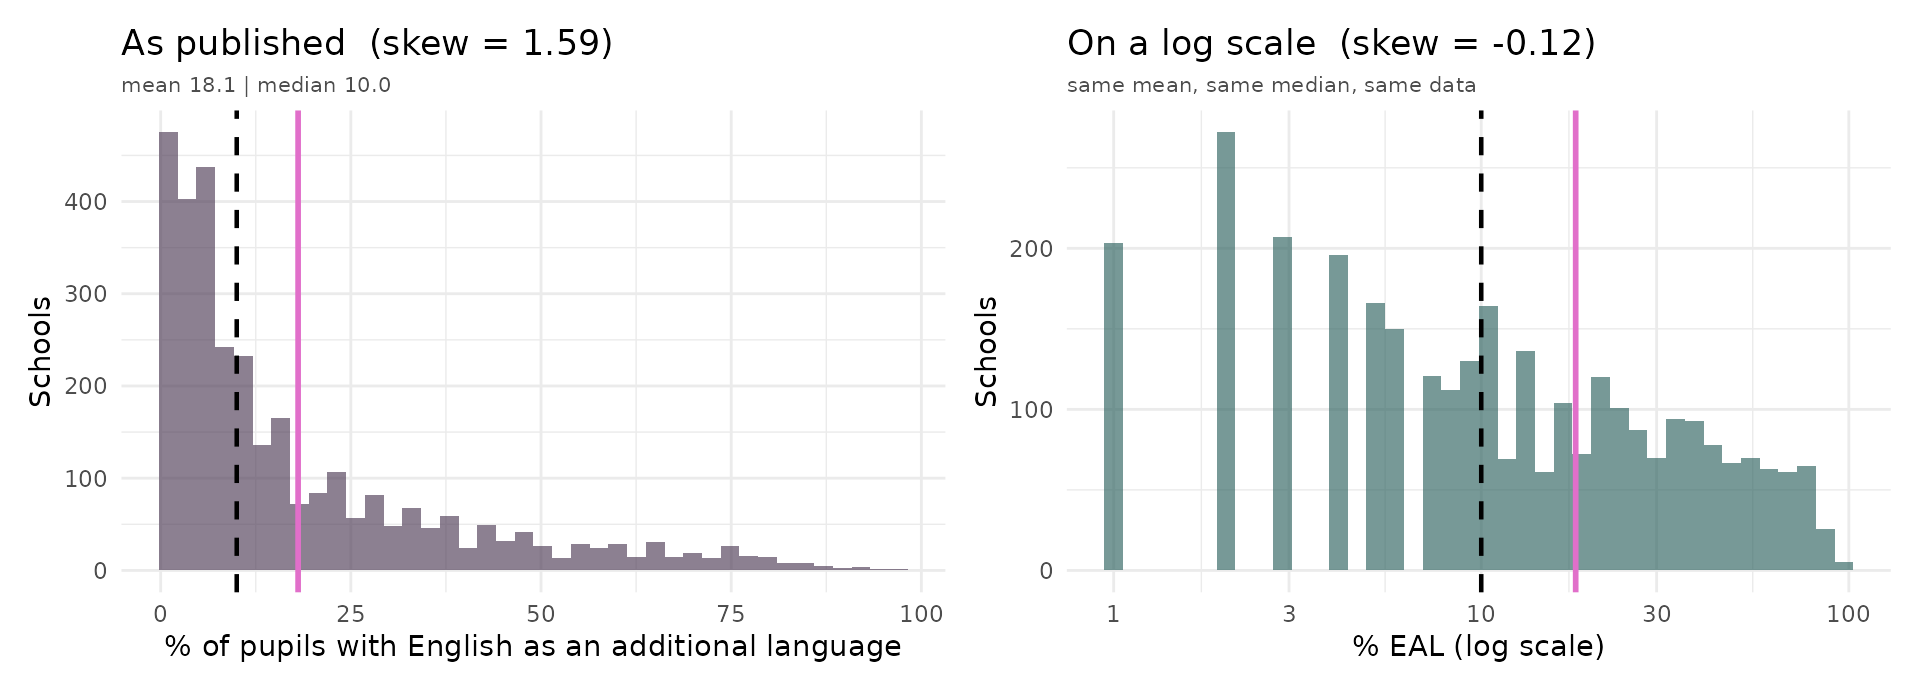
- Strictly positive, and strongly skewed (mean and median very different) — most schools have few EAL pupils, a long tail have very many
- Both panels show the same percentages, the same mean and the same median. Only the spacing of the axis changes: equal distances now mean equal multiples rather than equal amounts (additive)
- On that spacing the distribution is very nearly symmetric, and the mean sits close to the middle of it
- This is not a trick. It is what the data type tells us to do — and it is exactly what we do in week 6 when we fit a log-log model.
Real-valued multiplicative
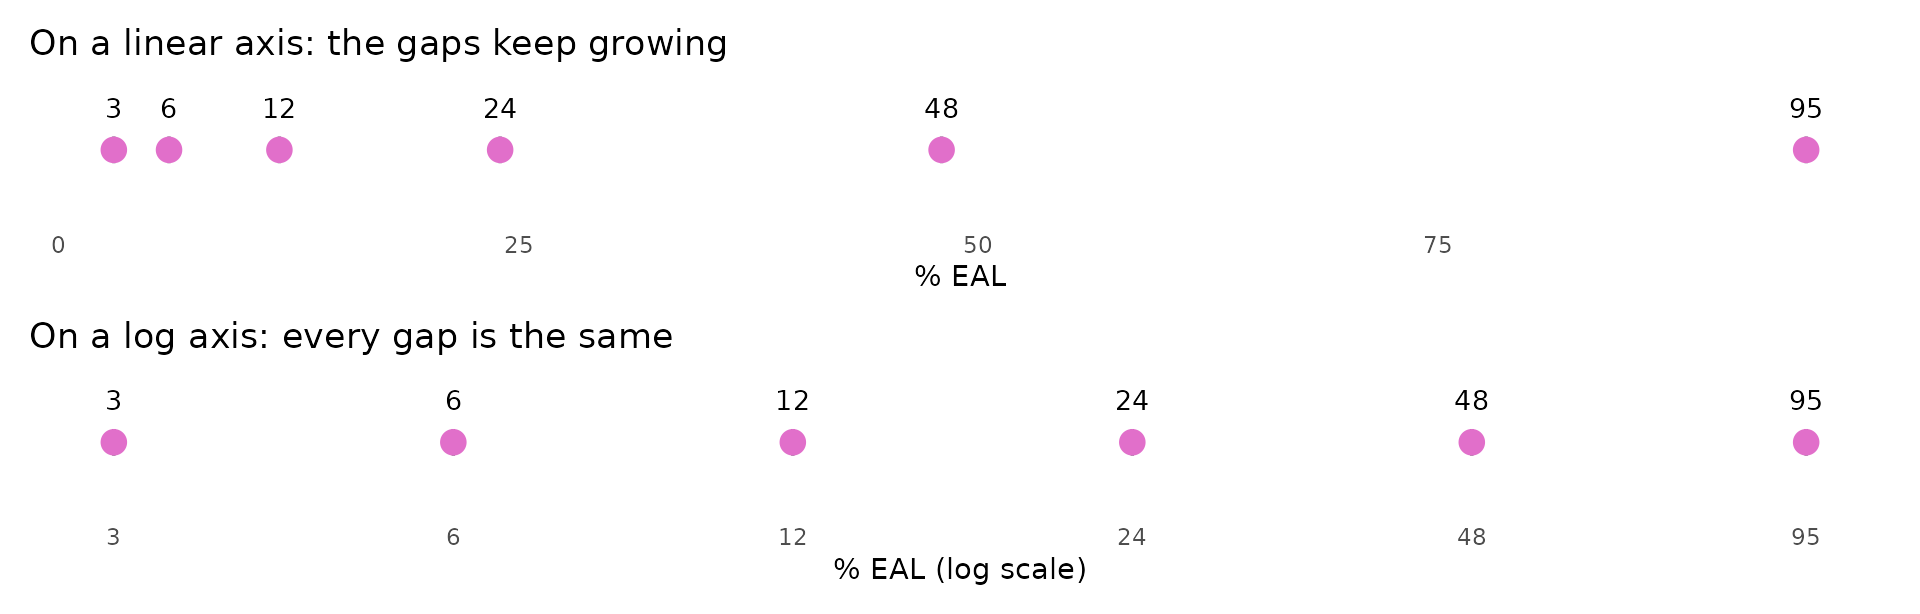
Six real schools, each with roughly twice the share of the one before. The jump from 3% to 6% and the jump from 48% to 96% are the same size — as multiples. A logarithmic axis is simply an axis that agrees.
Next week. Bea takes this apart properly — exponentials, logarithms, and when to reach for them. For now, just notice that changing the spacing changed the shape.
So why is the mean below the median?
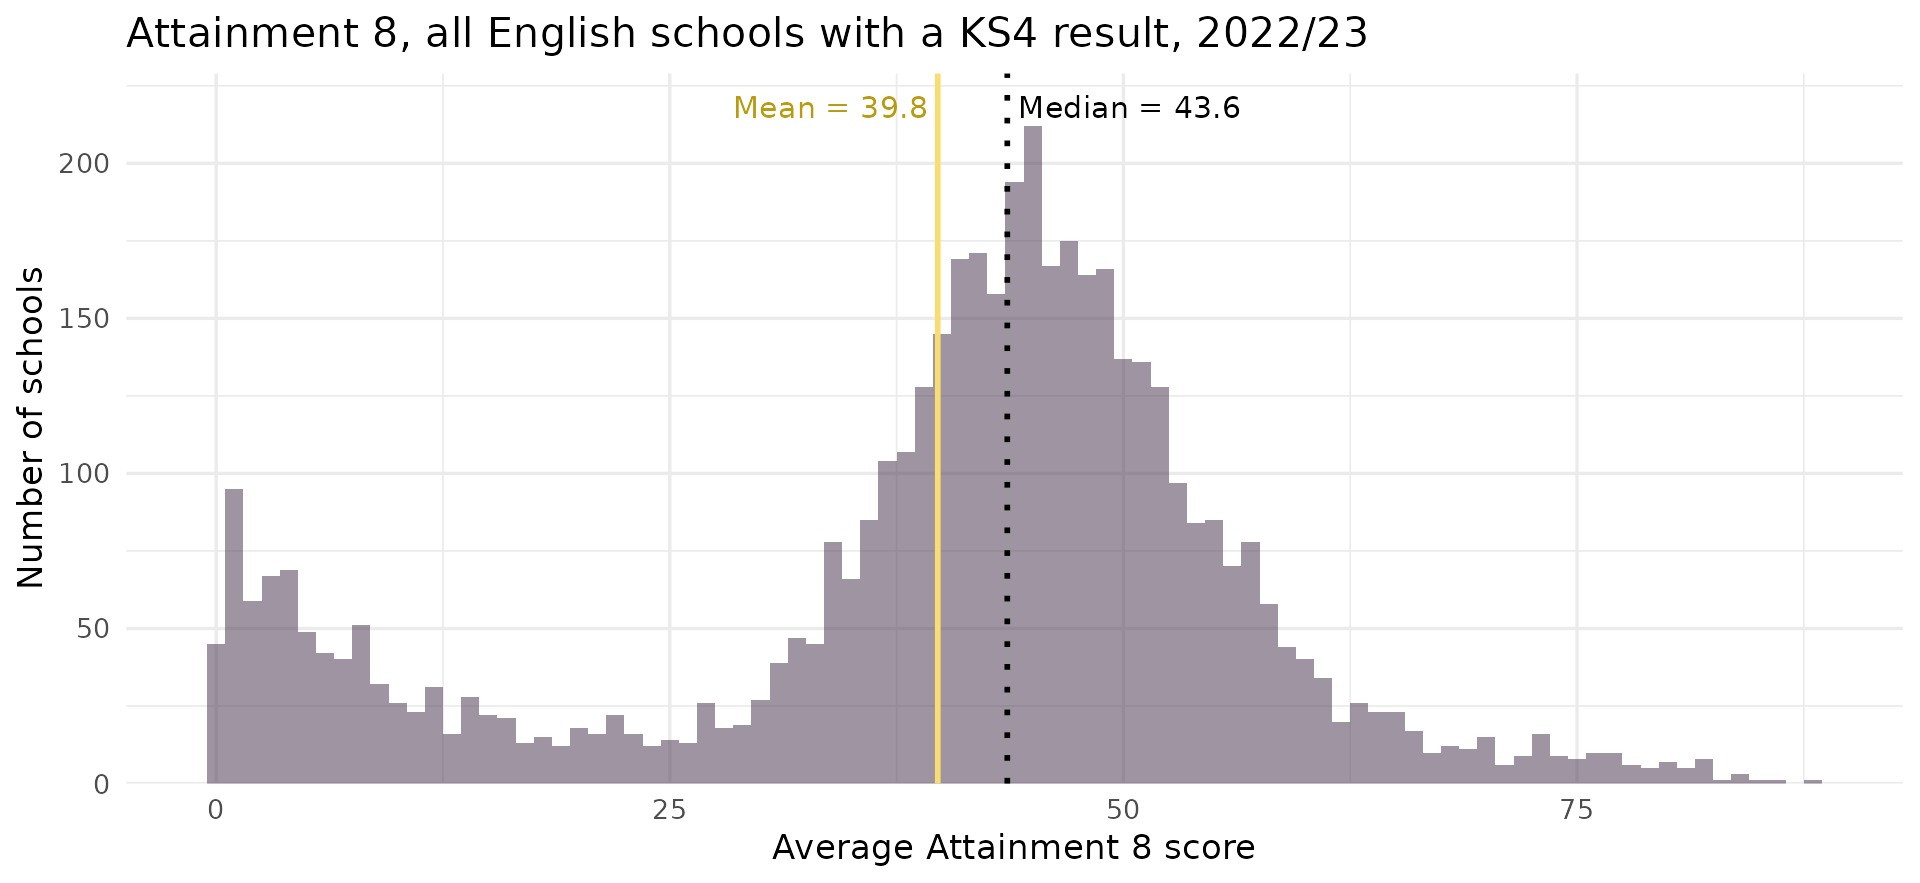
- One summary table told us mean < median. One picture tells us why.
- There is a whole second population of schools down at the left.
The same data, split by school type
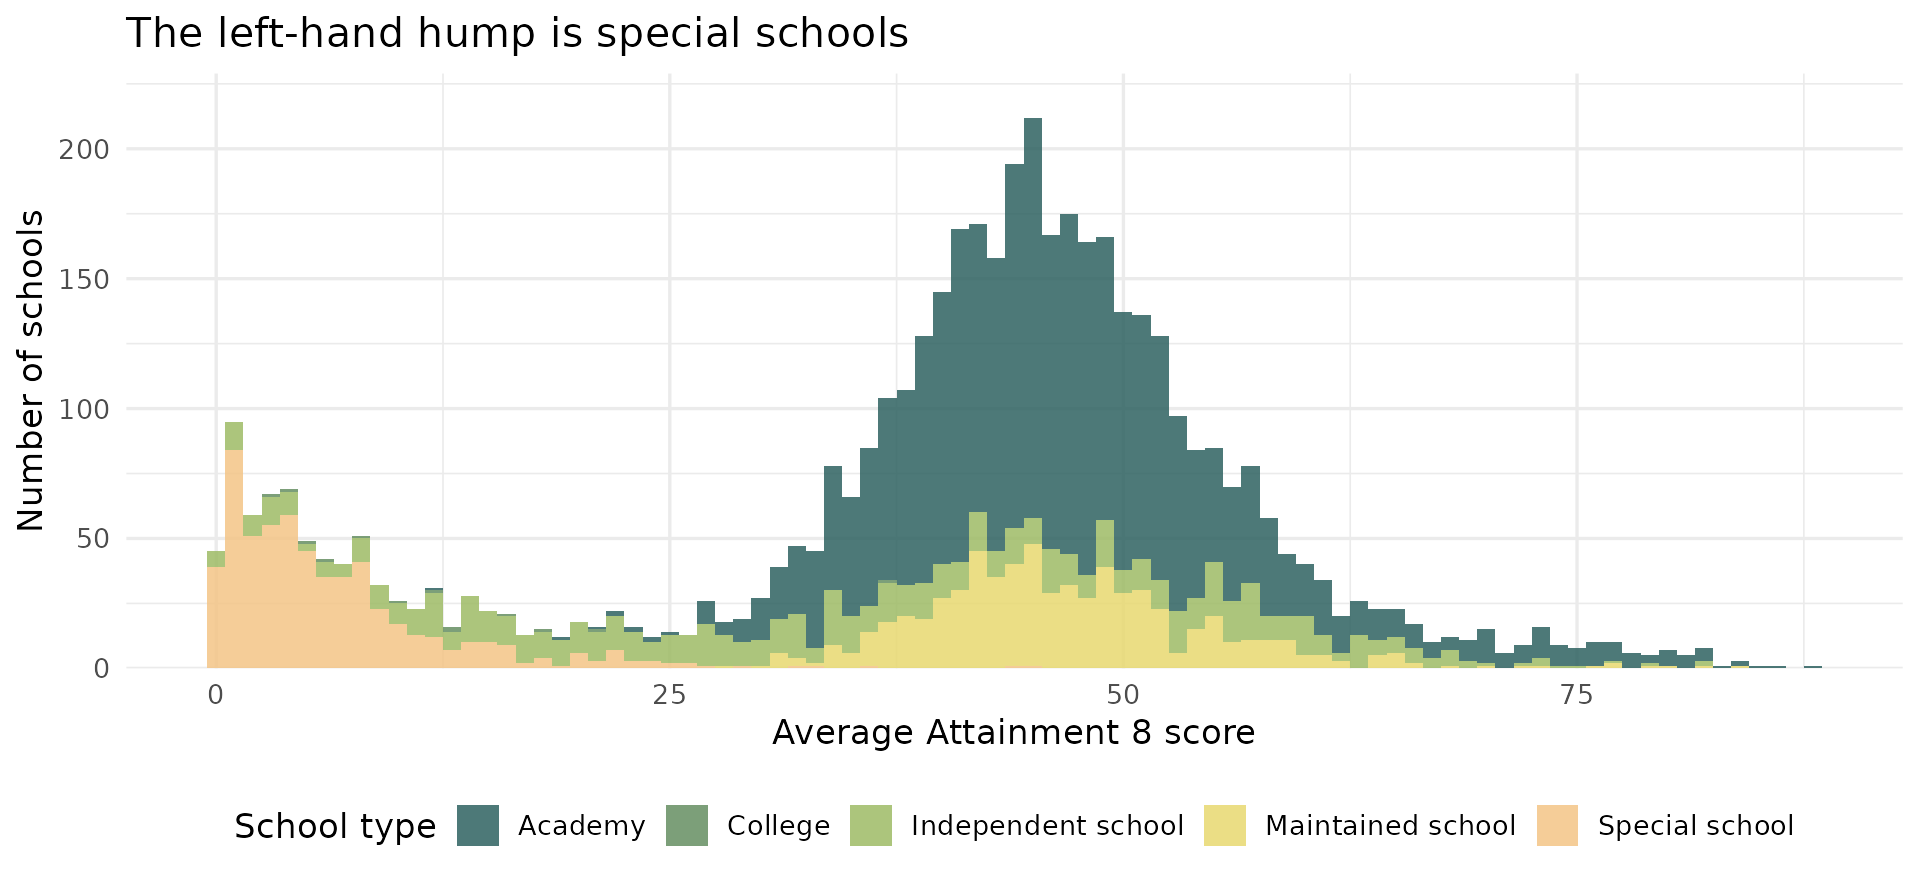
- Special schools educate pupils with significant special educational needs
- Attainment 8 was never designed to compare them with mainstream schools
The middle is not enough
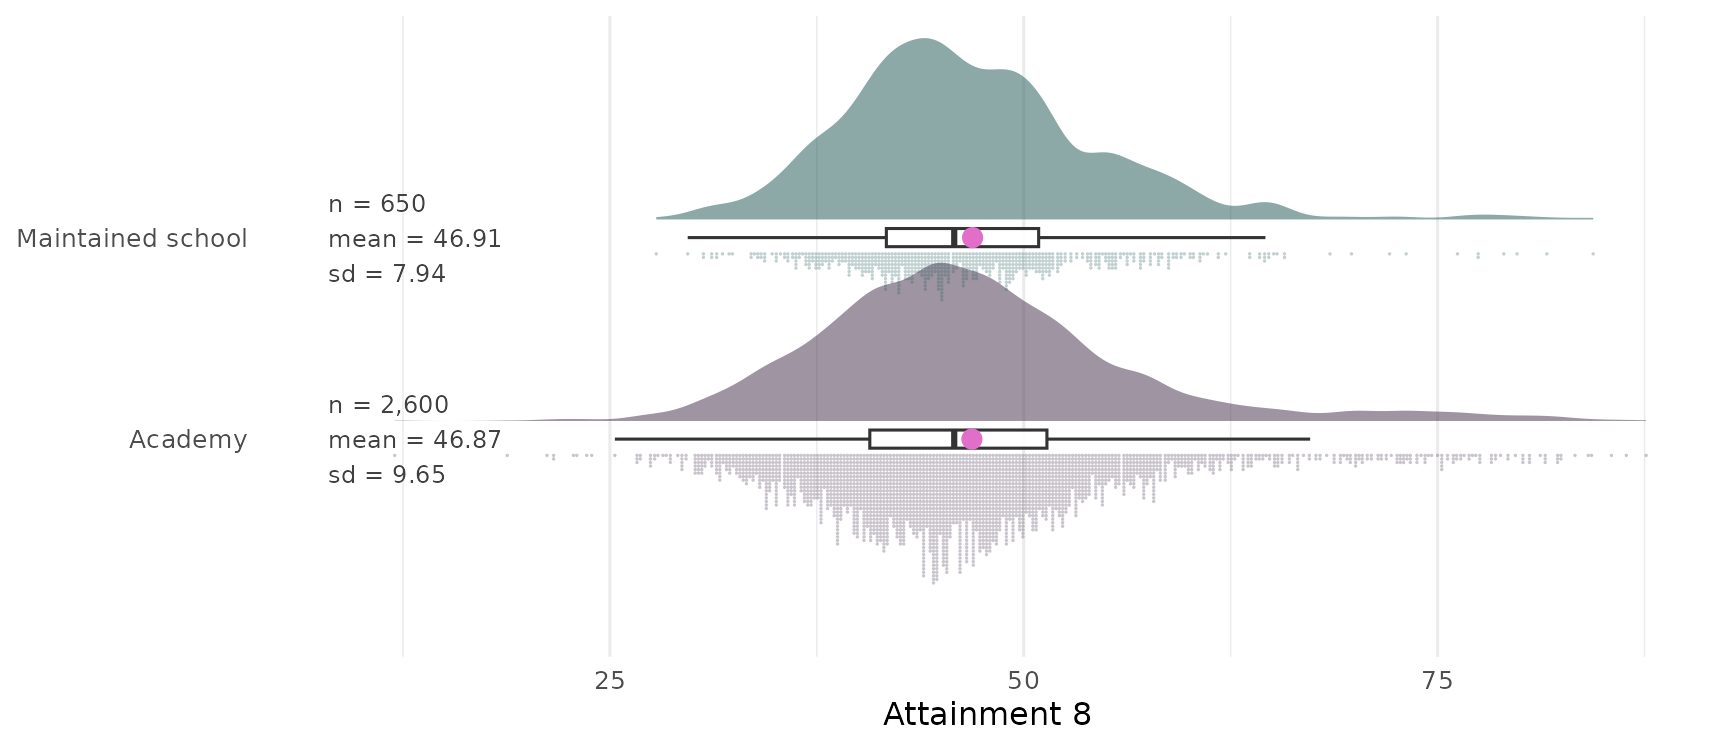
- The two means differ by 0.04 of a point — for practical purposes, identical
- The spread does not: academies are noticeably wider (more rain) - larger variance
- Report only the mean and these two look like the same story. They are not.
Spread across all four school types
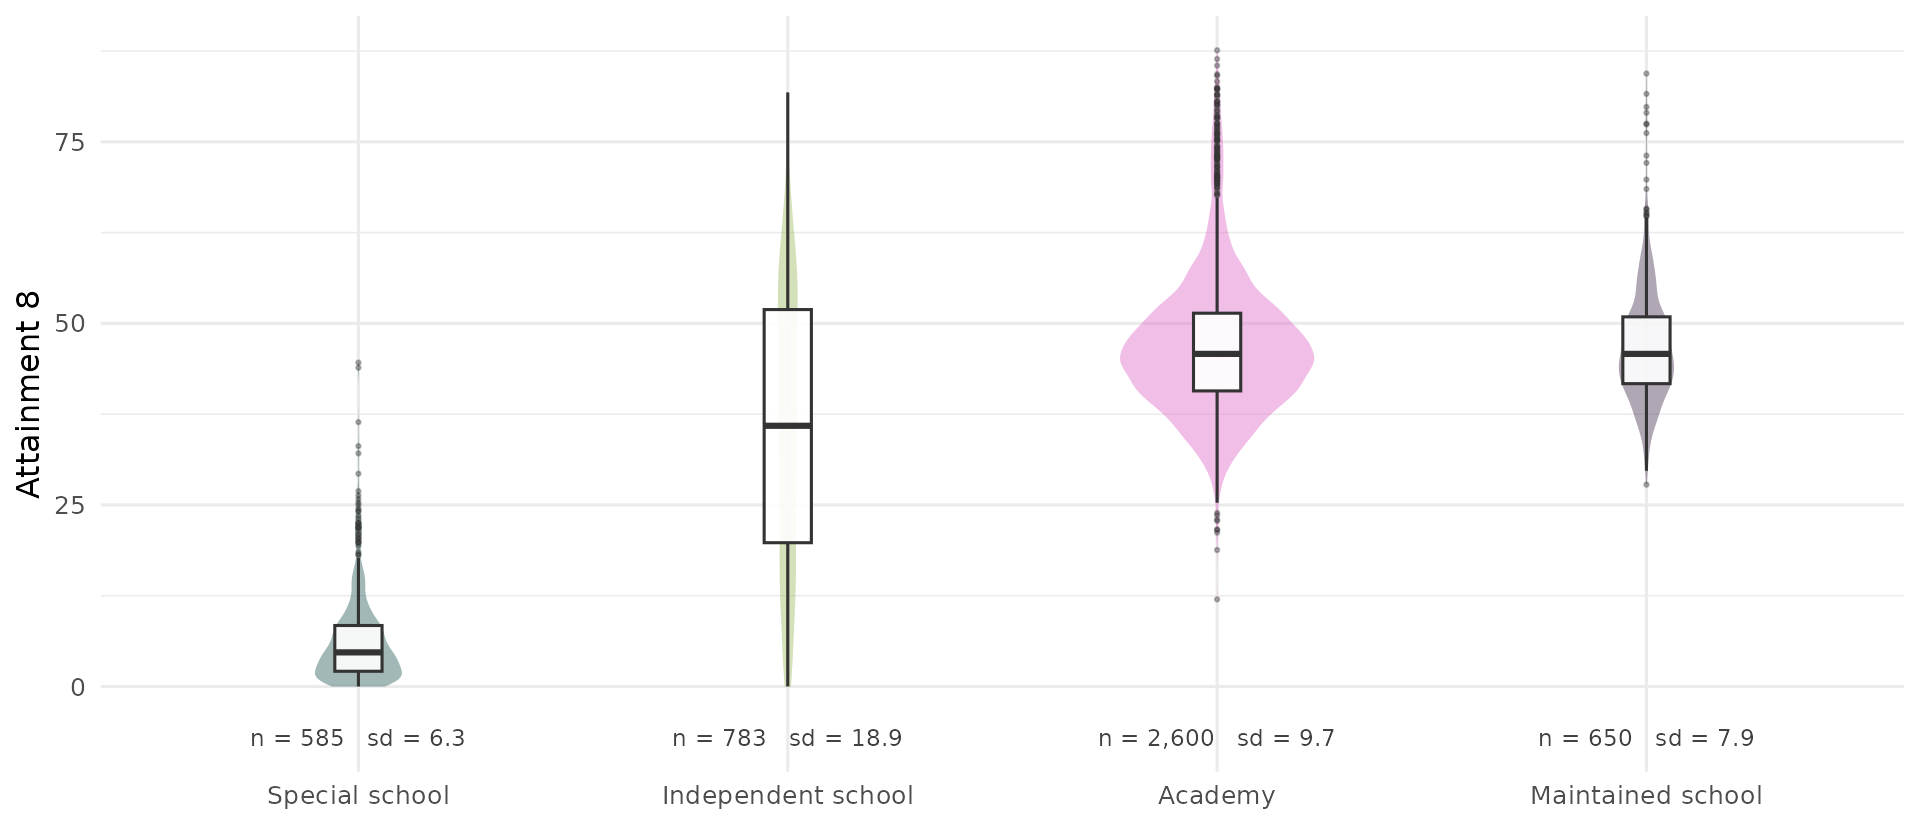
- The box gives you the median, the quartiles and the outliers
- The width of the violin is proportional to how many schools are in that group — a boxplot alone would hide that
- Independent schools: widest spread by far (sd 18.9), and the only group where the box spans more than 30 points
When is the mean a good summary?
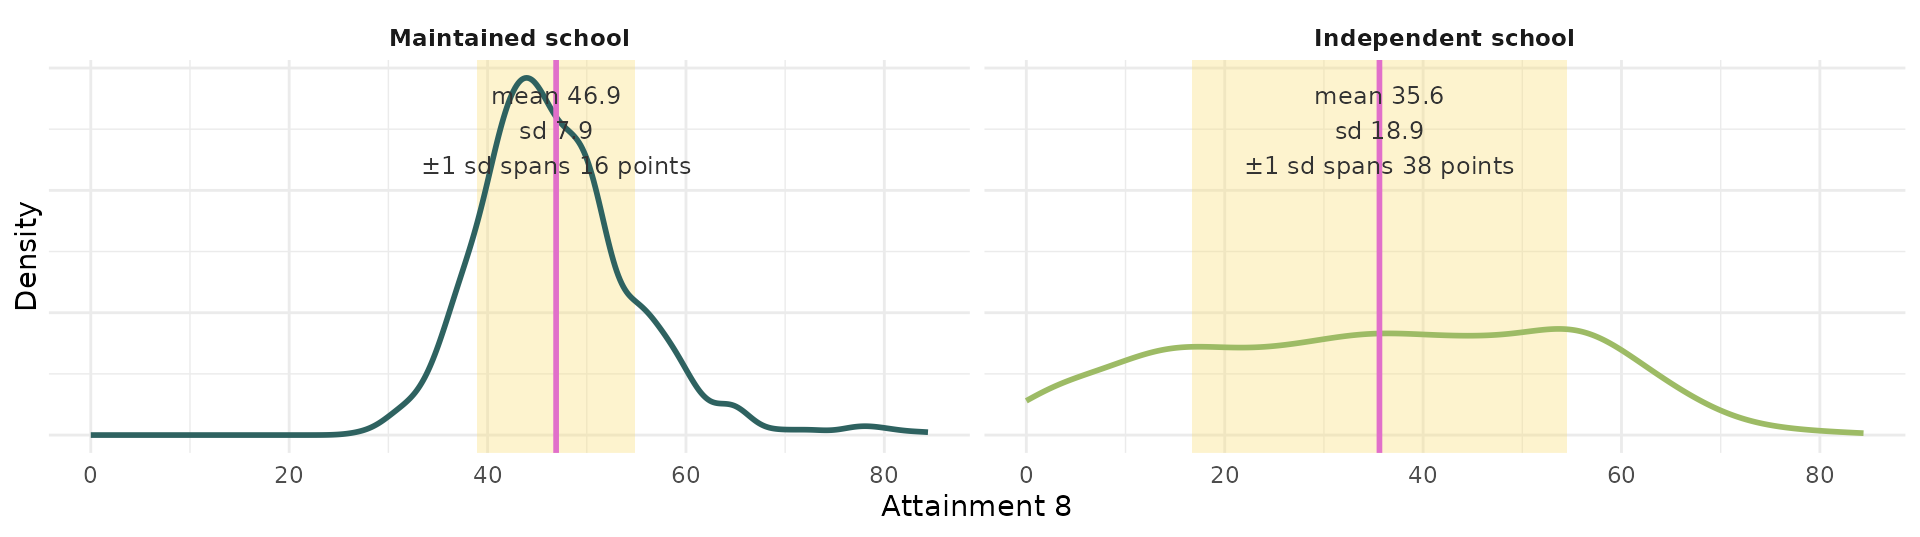
- Mean a better summary when variance is small and distribution normal
- If the data are roughly normal, about two thirds of observations sit inside the shaded band
- For maintained schools that band is ~16 points wide — the mean tells you a lot
- For independent schools it is ~38 points — more than a third of the whole 0–90 scale
- Same statistic. Very different amount of information.
We are borrowing something here. “Roughly normal” and “about two thirds” are properties of a specific distribution that we have not defined. Next week Bea makes both precise — for now, take the two-thirds rule on trust and notice what it buys you.
A mean without a spread is half a number
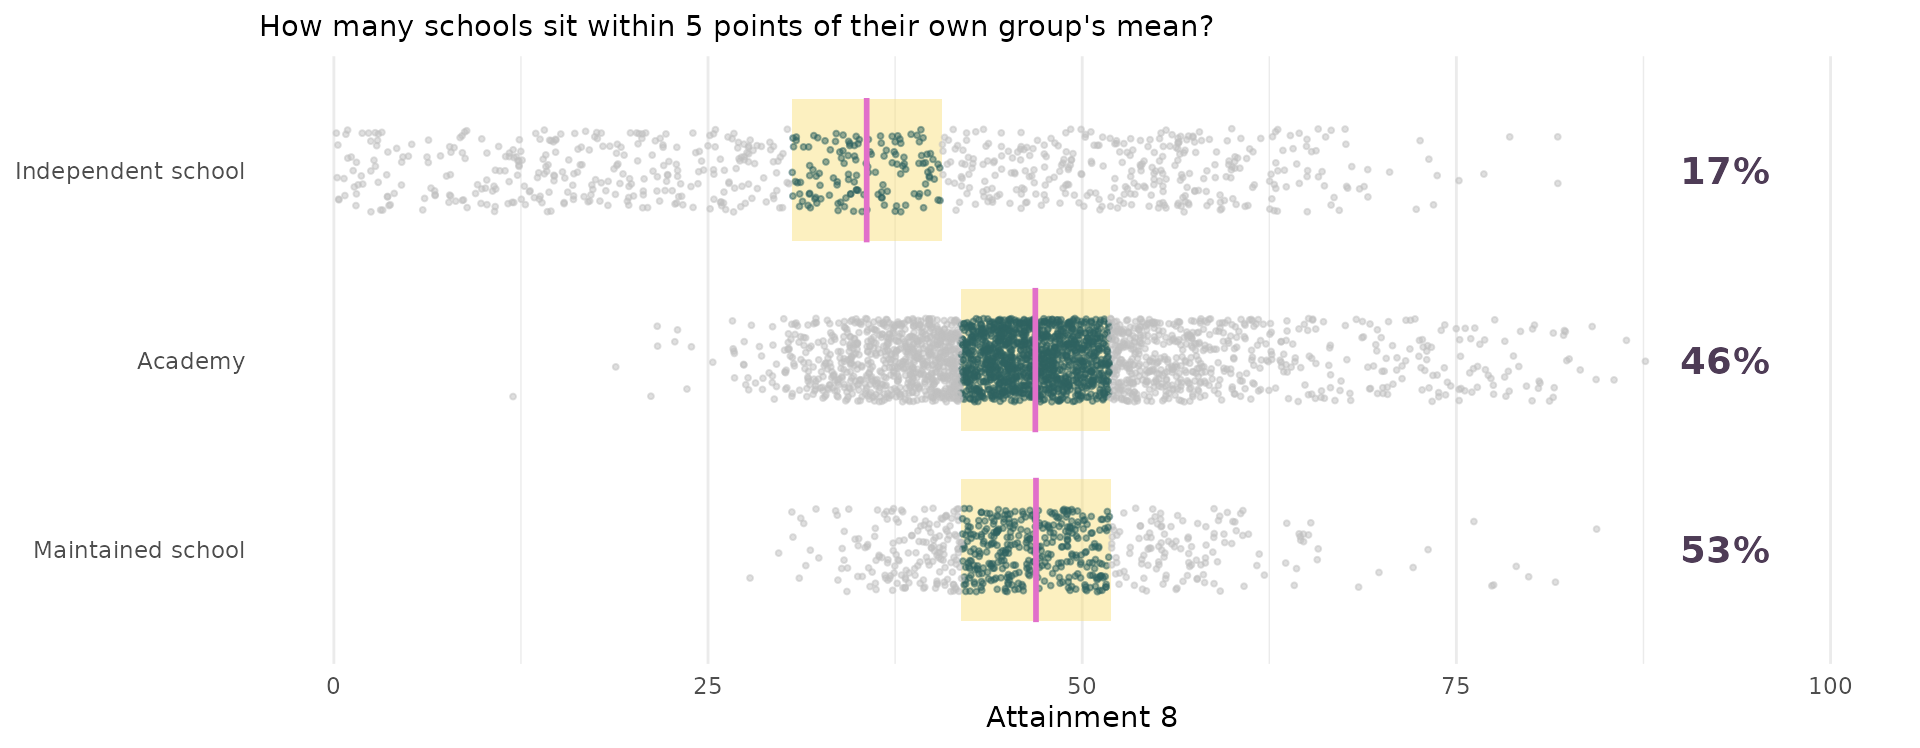
- Same window, same width, three very different answers
- A large standard deviation means individual cases sit far from the mean, so the mean describes no one in particular — for independent schools it speaks for fewer than one school in five
- A small standard deviation means the mean is a good stand-in for a typical case
- This is why you should never report a mean on its own
Big schools have big numbers
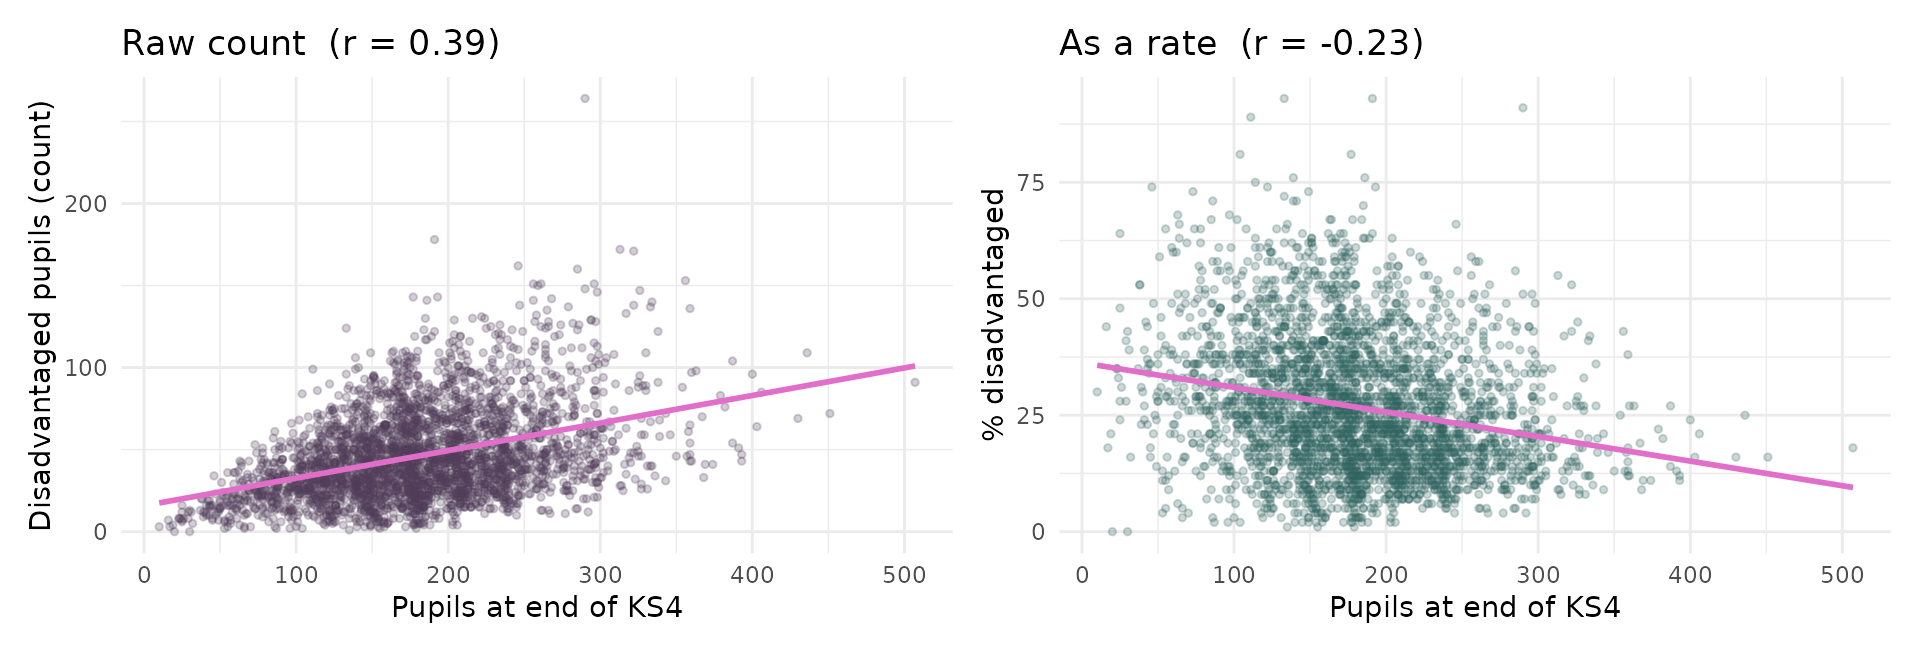
- The left panel is a strong relationship that tells you nothing: big schools have more of everything
- The right panel divides by size, and the relationship all but vanishes
- Raw counts mostly measure how big a place is. Almost always, you want a rate.
- A rate removes the effect of size. It does not make different variables comparable with each other — a percentage and a head-count still live on different scales. That needs one more step.
One school, five variables
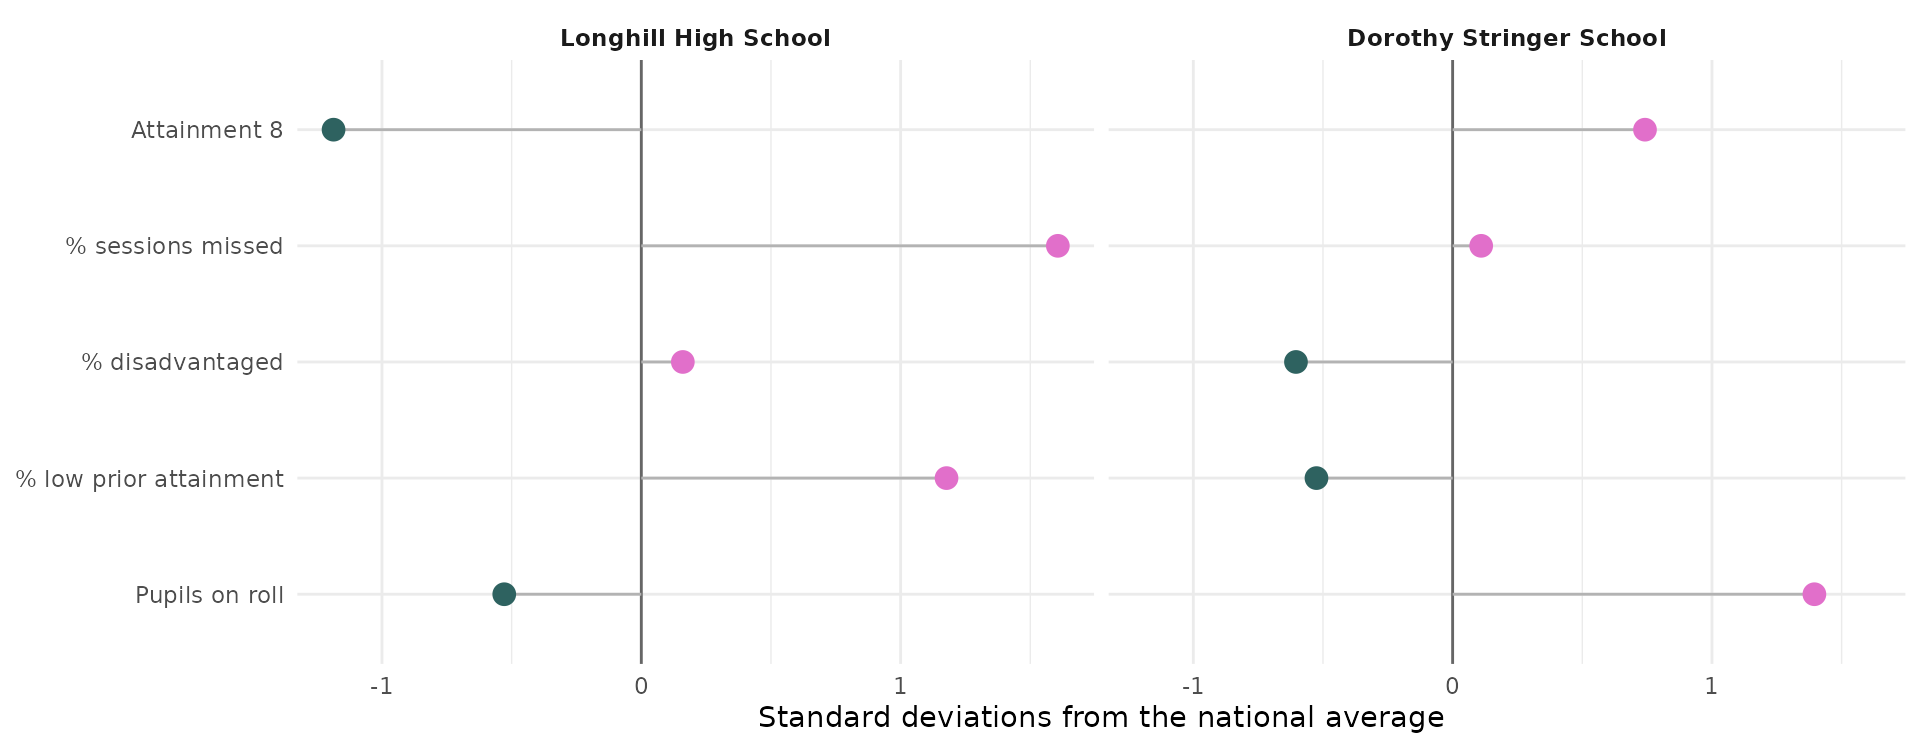
- Five variables, five different units, one readable picture
- Two schools three miles apart in Brighton, with mirror-image profiles
- Longhill sits well above average on absence and below it on attainment — while its disadvantage is only just above average
- That contrast is the question weeks 6 to 8 spend three weeks answering
Missing values have a distribution too
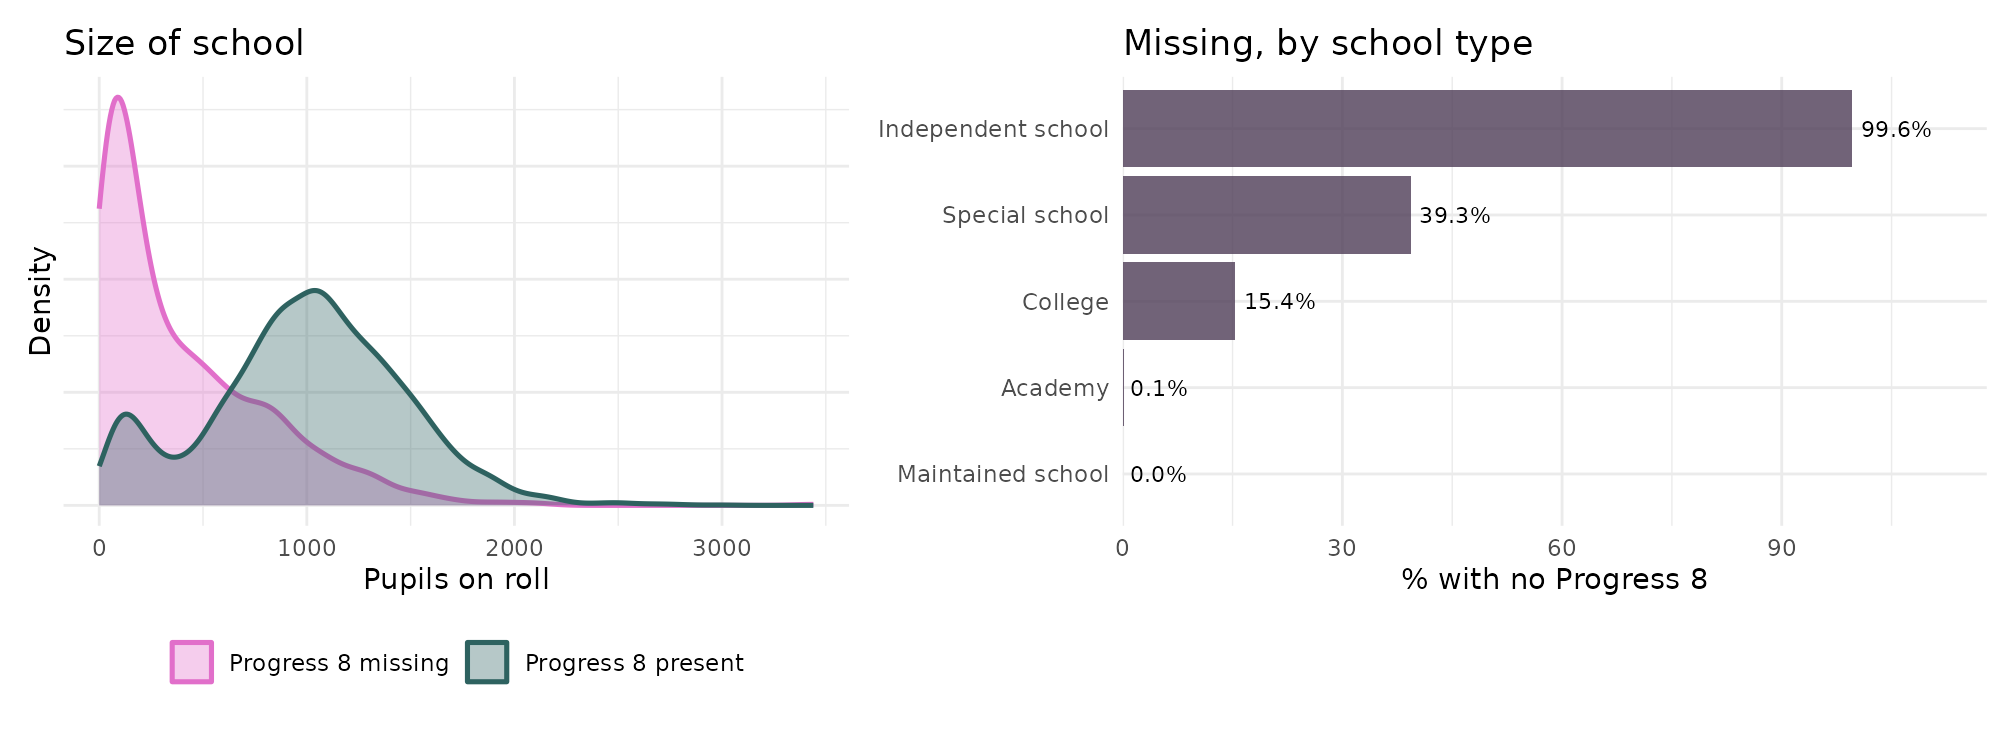
- If values went missing at random, the two curves on the left would sit on top of each other
- Median size where Progress 8 is missing: 247 pupils. Where it is present: 1,019
- Independent schools are missing it 99.6% of the time; maintained schools 0.0%